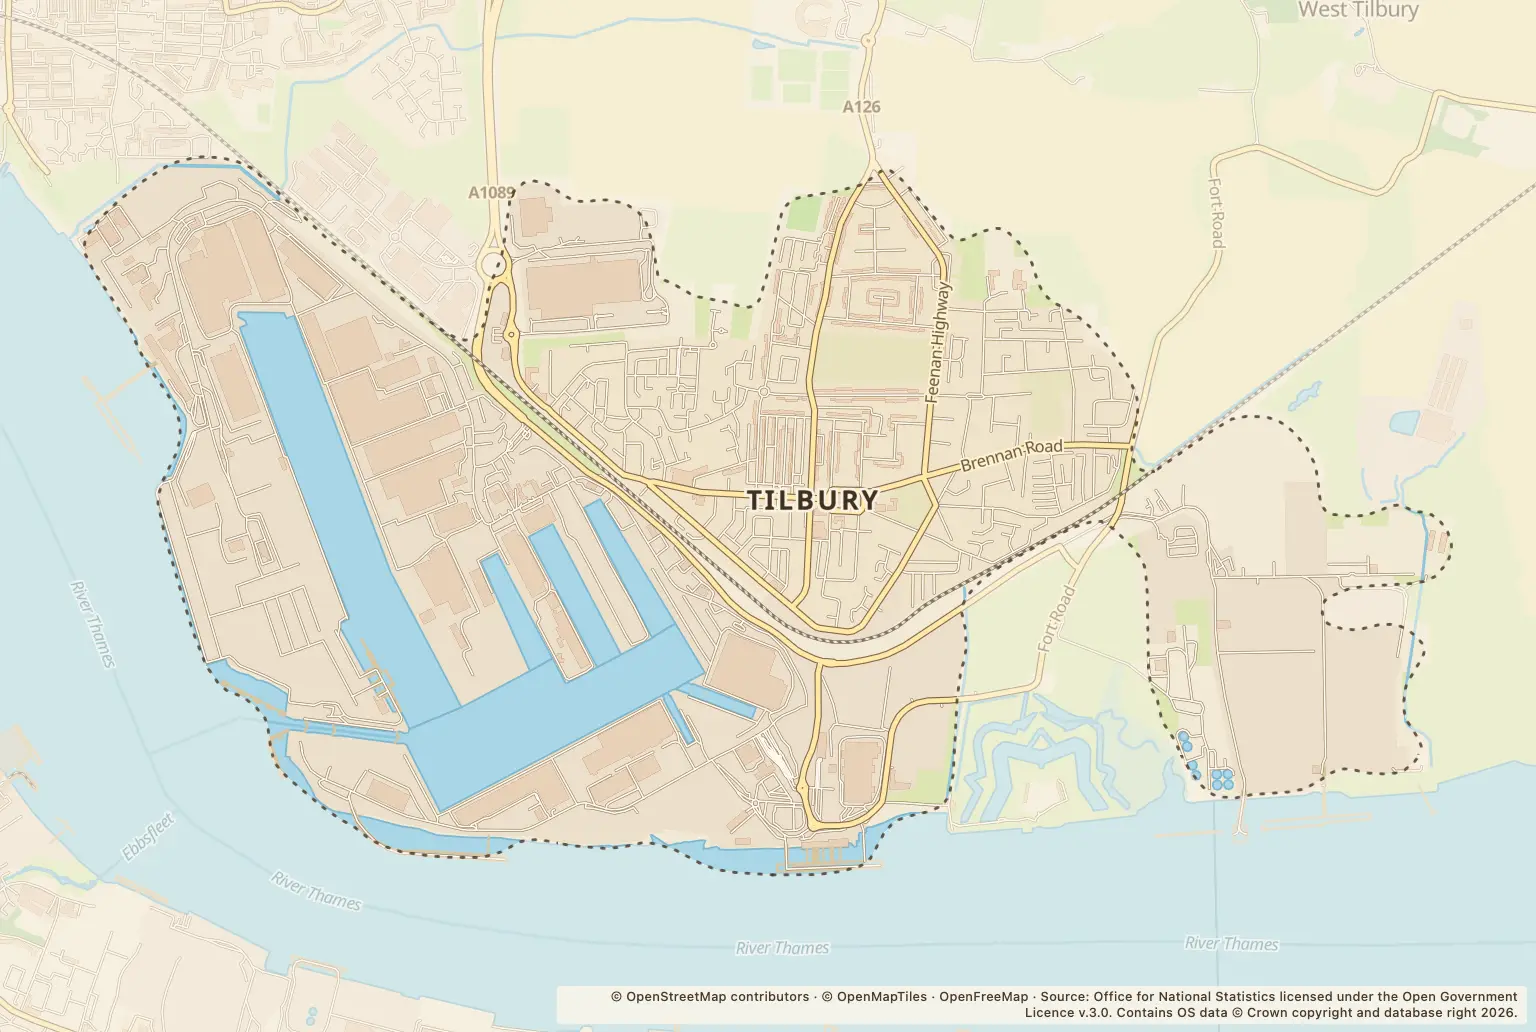
Tilbury had 2080 recorded crimes in 2025. Violence and sexual offences were the largest category, at 743; anti-social behaviour and criminal damage and arson followed.
What types of crime were recorded in Tilbury in 2025?
| Crime category | Recorded crimes |
|---|---|
| Violence and sexual offences | 743 |
| Anti-social behaviour | 261 |
| Criminal damage and arson | 259 |
| Vehicle crime | 230 |
| Shoplifting | 117 |
| Other theft | 115 |
| Public order | 99 |
| Burglary | 81 |
| Drugs | 68 |
| Other crime | 49 |
| Robbery | 29 |
| Possession of weapons | 17 |
| Bicycle theft | 7 |
| Theft from the person | 5 |
Source: police.uk Street-level crime figures for 2025.
When were recorded crimes highest in Tilbury?
July had the highest monthly total, at 215. January had 140, the lowest monthly figure in the year. The figures show what happened in 2025, but do not establish whether the same pattern occurs every year.
Does 2080 show Tilbury's crime rate?
No. It is a count of recorded crimes, not a rate per resident or household. The figures do not include a population measure or comparable totals for Thurrock and Essex, so they cannot show whether Tilbury had a higher rate than neighbouring areas.
How can I check crime near a home in Tilbury?
Use the police.uk crime map and neighbourhood policing team to check recorded crime around an area and find local policing information. Treat street-level figures as a guide to reported crime, not a measure of the risk at a particular home.
About the figures
police.uk's Street-level crime figures cover January to December 2025. The publication date is not stated here. These are recorded offences: they do not include crimes that were not reported or recorded, and the annual count alone does not provide a crime rate.