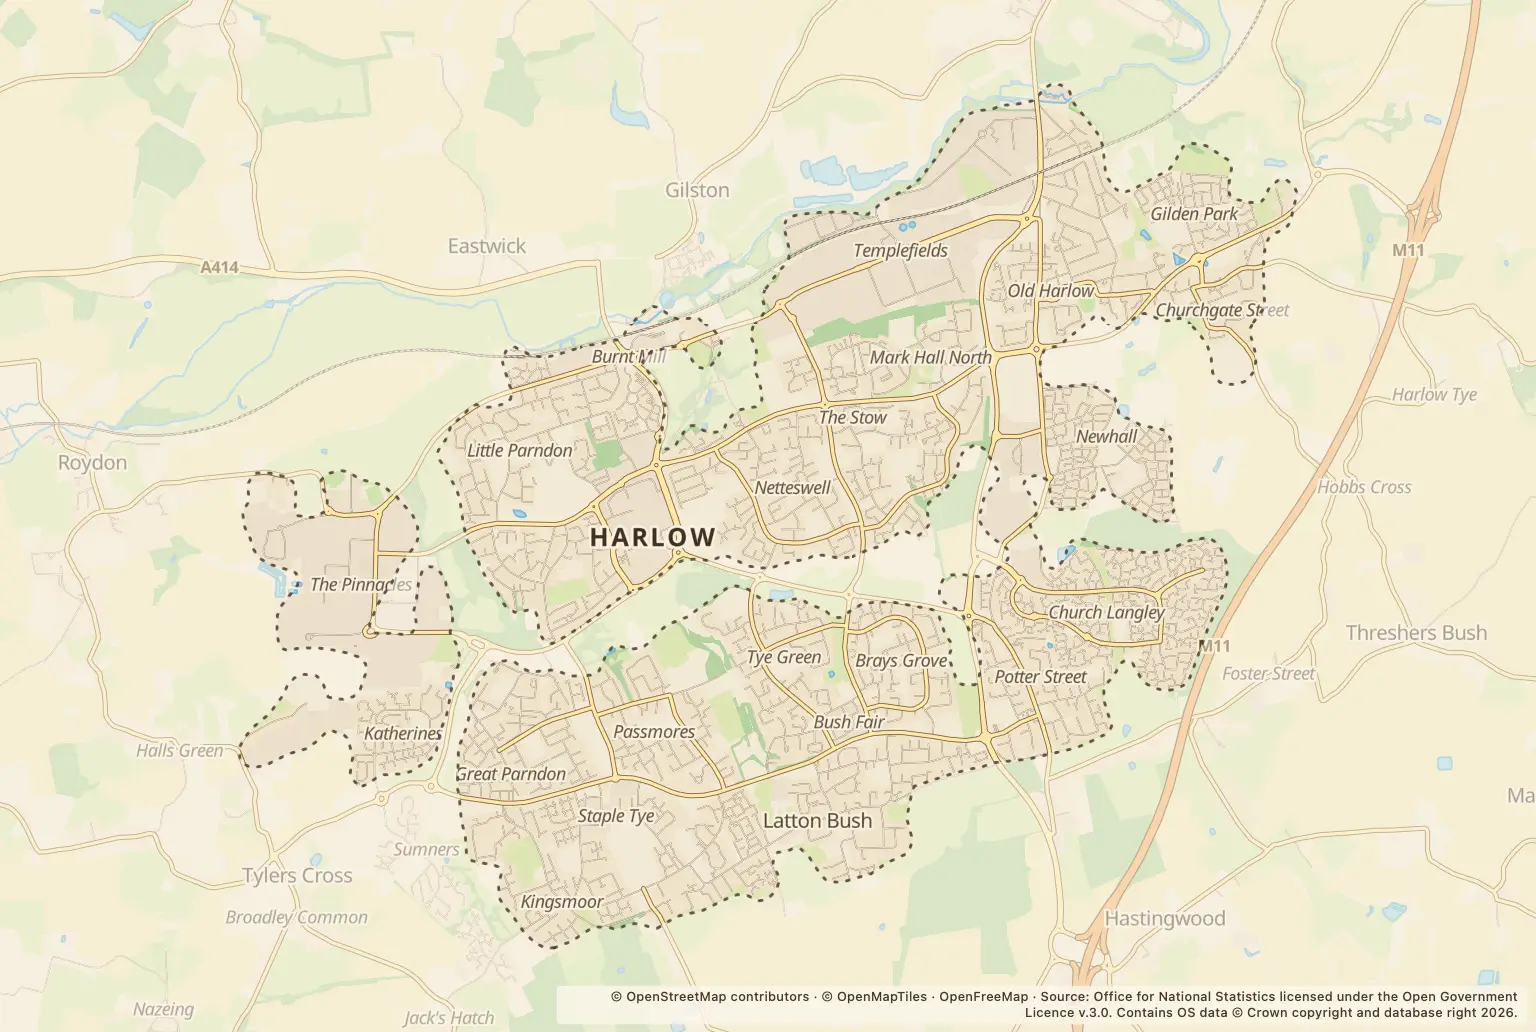
For anyone choosing a home in Harlow, the annual total is useful context, but it is not a street-by-street risk score: police.uk recorded 10436 crimes in 2025.
The total does not show how many residents were victims or give a crime rate per 1,000 people. It cannot, on its own, tell you how safe a particular home or neighbourhood will feel.
Which offences made up Harlow’s 2025 crime figures?
Violence and sexual offences made up the largest category. The counts below show the range of recorded offences, but they do not describe the circumstances or outcomes of individual reports.
| Offence category | Recorded crimes |
|---|---|
| Violence and sexual offences | 4097 |
| Anti-social behaviour | 900 |
| Public order | 896 |
| Shoplifting | 870 |
| Criminal damage and arson | 848 |
| Vehicle crime | 635 |
| Drugs | 619 |
| Other theft | 614 |
| Burglary | 260 |
| Other crime | 247 |
| Possession of weapons | 147 |
| Robbery | 110 |
| Bicycle theft | 103 |
| Theft from the person | 90 |
Source: police.uk street-level crime figures for 2025.
Did recorded crime vary by month in Harlow?
July 2025 was the busiest month, with 969 recorded crimes. February had 758. The same month a year earlier, July 2024, had 929; these monthly counts do not establish a longer-term trend by themselves.
How can I check crime near a home in Harlow?
Look up the area you are considering on the police.uk crime map and neighbourhood policing team. Check more than one nearby location and read the offence categories alongside the totals. The annual figures here do not compare Harlow with neighbouring towns, the council area or Essex, and they are not a substitute for checking the specific area around a property.
About the figures
Police.uk street-level crime figures cover January to December 2025. They count crimes recorded by police; they do not give a per-resident rate or measure an individual’s chance of being affected. No publication date is stated alongside these annual figures.