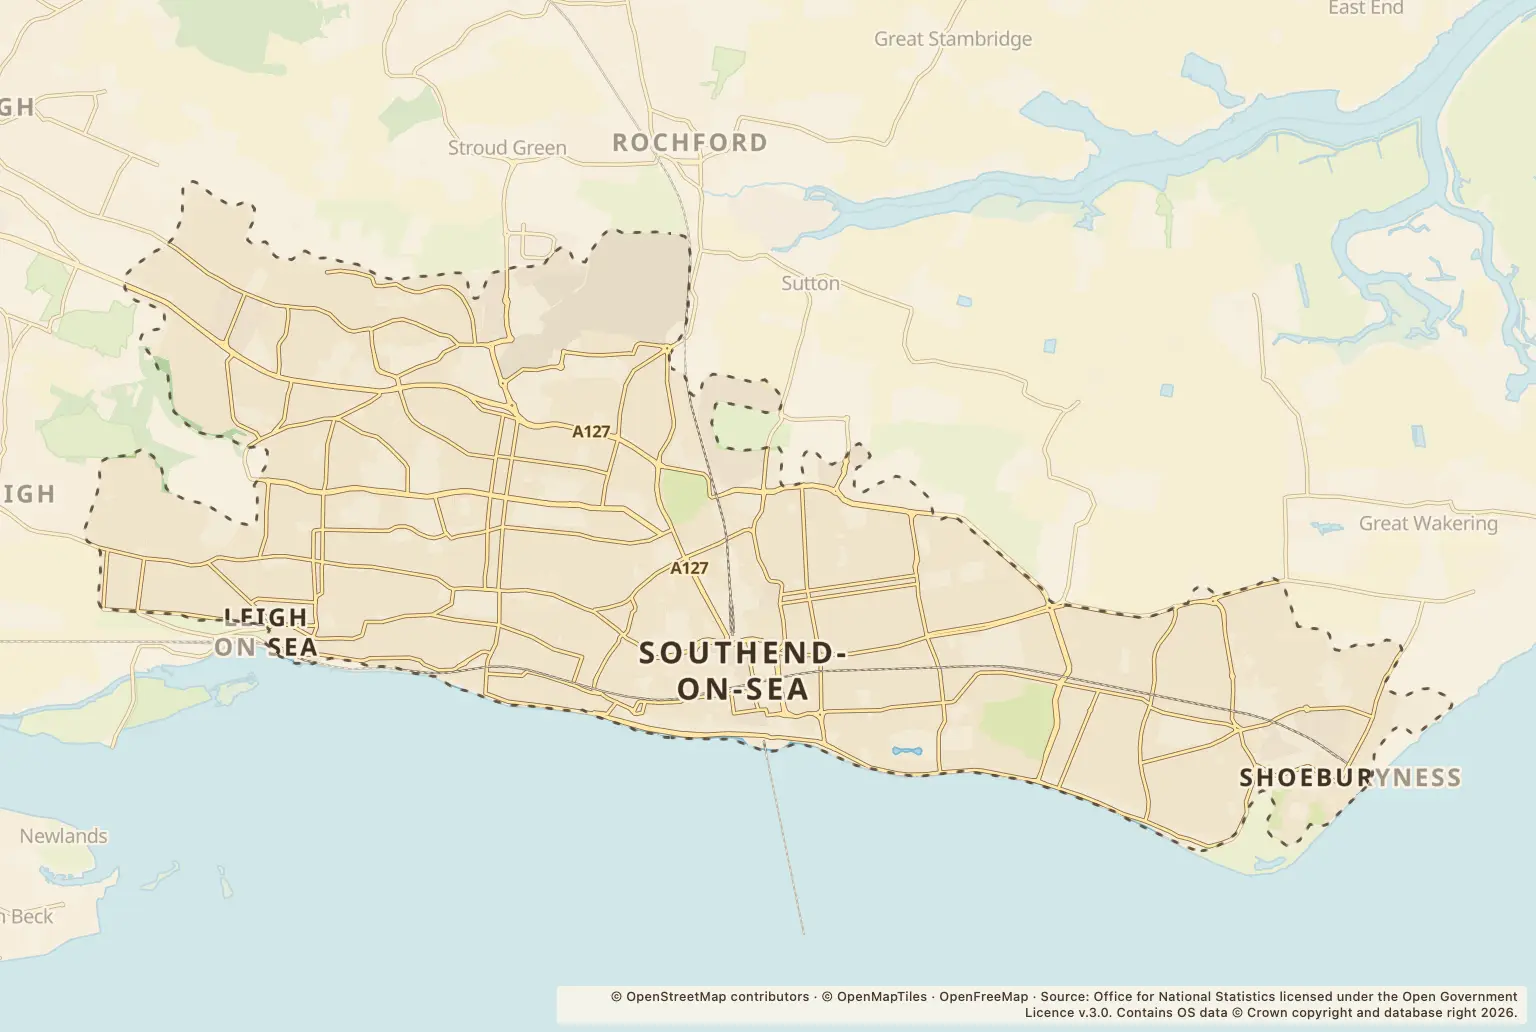
Police recorded 1840 crimes in Southend-on-Sea in September 2026, up 15% from 1606 in September 2025.
For people choosing where to live, the detail matters more than the headline: crime categories moved in different directions, and the monthly totals do not show the risk at a particular home.
Which types of crime rose or fell in Southend-on-Sea?
Anti-social behaviour had the biggest stated year-on-year percentage rise, up 71% from 141 to 241. Shoplifting rose 34%, from 162 to 217, and violence and sexual offences increased 12%, from 633 to 708.
Not every category increased. Robbery fell 70%, from 33 to 10, while burglary was down 18%, from 57 to 47. The figures below show the September totals and the comparison with the same month a year earlier.
| Crime category | September 2026 | September 2025 | Change |
|---|---|---|---|
| Anti-social behaviour | 241 | 141 | up 71% |
| Bicycle theft | 23 | 16 | up 44% |
| Burglary | 47 | 57 | down 18% |
| Criminal damage and arson | 111 | 94 | up 18% |
| Drugs | 71 | 90 | down 21% |
| Other theft | 116 | 107 | up 8% |
| Possession of weapons | 24 | 29 | down 17% |
| Public order | 120 | 100 | up 20% |
| Robbery | 10 | 33 | down 70% |
| Shoplifting | 217 | 162 | up 34% |
| Theft from the person | 25 | 15 | up 67% |
| Vehicle crime | 94 | 96 | down 2% |
| Violence and sexual offences | 708 | 633 | up 12% |
| Other crime | 33 | 33 | unchanged |
Source: police.uk Street-level crime figures for September 2026, compared with September 2025.
Was recorded crime lower than in August?
Yes. Southend-on-Sea recorded 1840 crimes in September, compared with 2168 in August 2026 and 2319 in July 2026. The September total was also higher than the 1606 recorded in September 2025.
A single month can move differently from the year-on-year comparison. These figures show the counts for each month, not why they changed.
Which Southend-on-Sea locations had the most reports?
The highest September counts in the published location list were for a Petrol Station, with 117, and a Parking Area, with 106. A Supermarket had 65, while Great Eastern Avenue had 48.
Some listed locations are types of place rather than residential streets. These counts do not show that a nearby home is at particular risk, and they should not be used on their own to judge an area.
How can I check crime near a home in Southend-on-Sea?
Use the police.uk crime map and neighbourhood policing team to check the local picture and find neighbourhood policing contacts. If you are considering a move, look at the specific streets and the types of crime that matter to you.
The figures here cover Southend-on-Sea only, so they do not provide a like-for-like comparison with neighbouring towns or Essex as a whole. They are counts, not a population-adjusted crime rate, and cannot show the likelihood of crime at an individual address.
About the figures
Police.uk publishes the Street-level crime figures. The latest month shown here is September 2026, compared with September 2025; no publication date is stated. The figures count recorded reports and do not provide a crime rate or a measure of risk for an individual home.