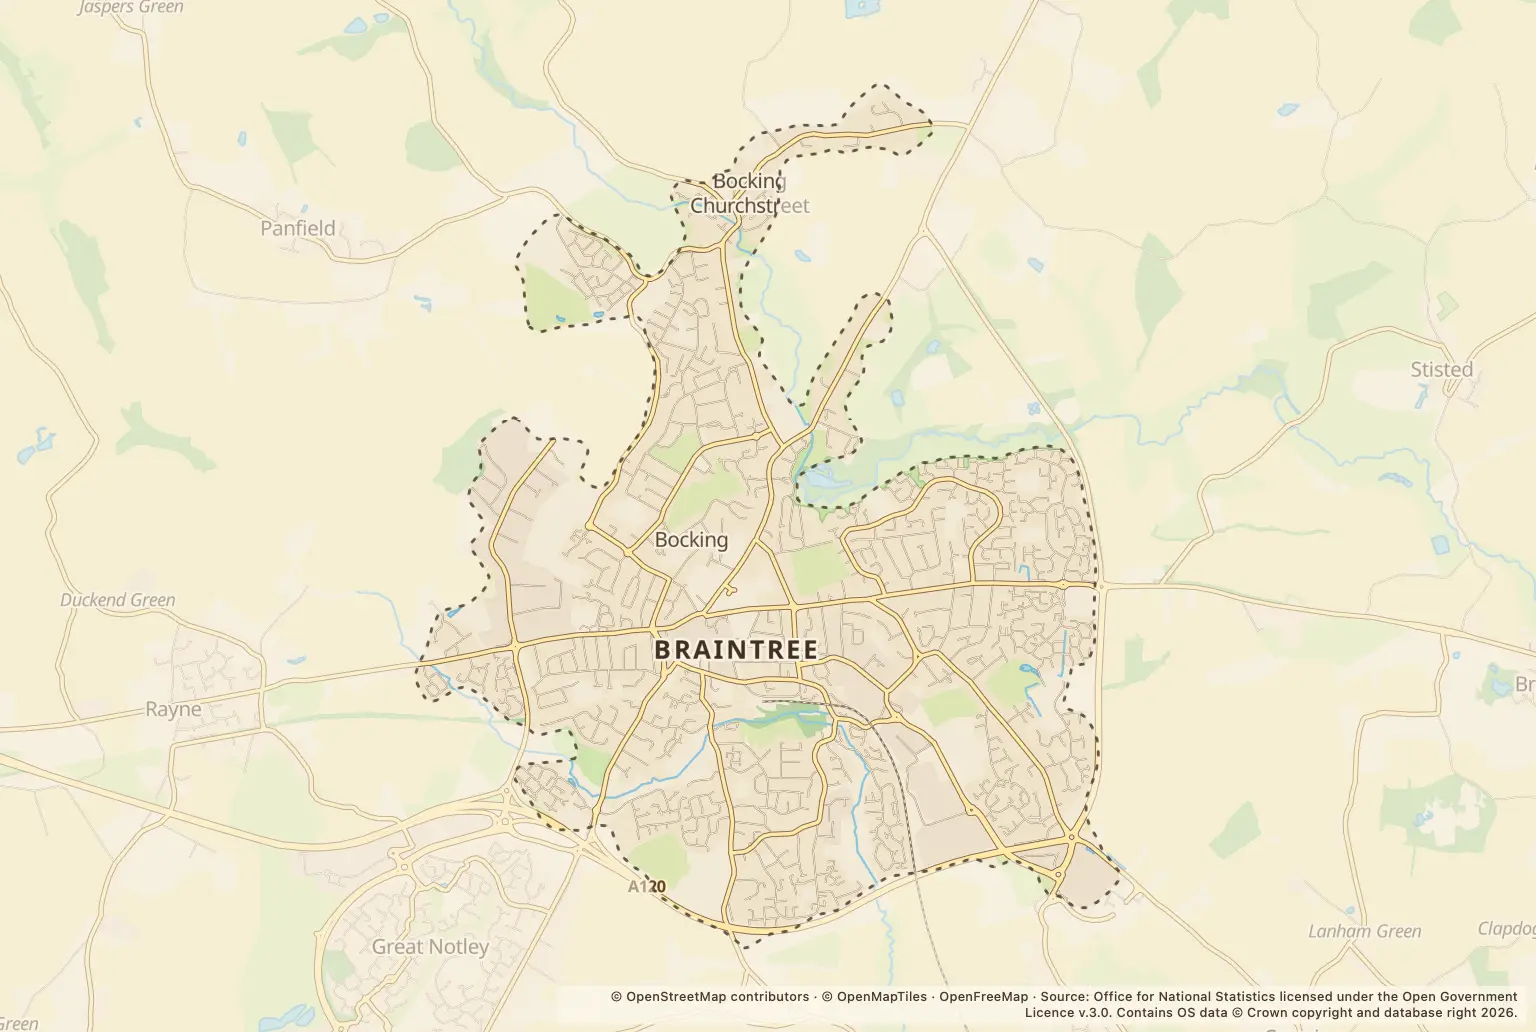
For anyone weighing up a move to Braintree, the headline is 301 recorded crimes in September 2026, compared with 273 in September 2025. The total was lower than the 360 recorded in August 2026, so one month’s figure should not be read as a steady trend.
Violence and sexual offences accounted for 129 offences. Annual rates offer a wider comparison: Braintree town’s rate was 79.9 per 1,000 residents in the 12 months to September 2026, while the Braintree district rate was 62.7.
Which types of crime changed most in Braintree?
Violence and sexual offences remained the biggest category, rising from 120 in September 2025 to 129 in September 2026. Anti-social behaviour rose from 19 to 40, and criminal damage and arson from 16 to 25. These month-to-month category counts do not show how likely an individual household is to be affected.
Some categories fell. Public order offences went from 27 to 21, while possession of weapons went from 2 to 0. Other theft was unchanged at 26.
| Crime type | September 2026 | September 2025 |
|---|---|---|
| Violence and sexual offences | 129 | 120 |
| Anti-social behaviour | 40 | 19 |
| Other theft | 26 | 26 |
| Criminal damage and arson | 25 | 16 |
| Public order | 21 | 27 |
| Shoplifting | 21 | 20 |
| Vehicle crime | 13 | 15 |
| Drugs | 10 | 9 |
| Burglary | 6 | 5 |
| Possession of weapons | 0 | 2 |
Source: police.uk Street-level crime figures for Braintree, comparing September 2026 with September 2025.
How does Braintree’s crime rate compare with Halstead and Essex?
Annual rates give a broader comparison than a single month. Police Statistics reports a rate of 79.9 per 1,000 residents for Braintree town in the 12 months to September 2026. Its figures put Halstead at 59.9, Braintree district at 62.7 and Essex at 81.5 for the same period.
These figures cover different-sized places: the Braintree district includes other towns and villages, while Braintree town is a town-level area. Rates also count crimes against the resident population, not the number of people visiting shops or other busy locations. They are useful for comparing places, but do not predict what will happen on a particular street.
| Area | Crimes per 1,000 residents |
|---|---|
| Braintree town | 79.9 |
| Halstead | 59.9 |
| Braintree district | 62.7 |
| Essex | 81.5 |
| England and Wales | 96.9 |
Source: Police Statistics, figures for the 12 months to September 2026, using police-recorded crime and population estimates.
Which Braintree streets and places had the most recorded crimes?
Charter Way had the highest count among the listed street and location labels, with 11. Parking Area and Shopping Area each had 10. These are counts, not crime rates: a shopping or parking location can have many visitors, and its figure does not tell you how many nearby residents were affected.
Use the figures as a prompt to check the precise area around a home, rather than as a ranking of the safest places to live.
| Street or location | Recorded crimes |
|---|---|
| Charter Way | 11 |
| Parking Area | 10 |
| Shopping Area | 10 |
| Supermarket | 9 |
| The Avenue | 9 |
| Market Place | 8 |
Source: police.uk Street-level crime figures for Braintree, September 2026.
How can I check crime near a Braintree home?
Search the police.uk crime map and neighbourhood policing team for the area around a property, and compare several recent months rather than relying on one figure. Check the map’s location descriptions carefully: labels such as Supermarket and Parking Area are not residential streets.
For a move, it is also worth viewing the area at different times of day and checking other practical factors, including local schools, transport and planned building. Crime counts alone cannot answer those questions.
About the figures
Police.uk’s Street-level crime figures cover recorded offences in Braintree in September 2026, with September 2025 counts used for the year-on-year comparison. The figures count recorded crimes, not all crime, and the monthly total is not a crime rate. The supplied figures do not state a publication date.