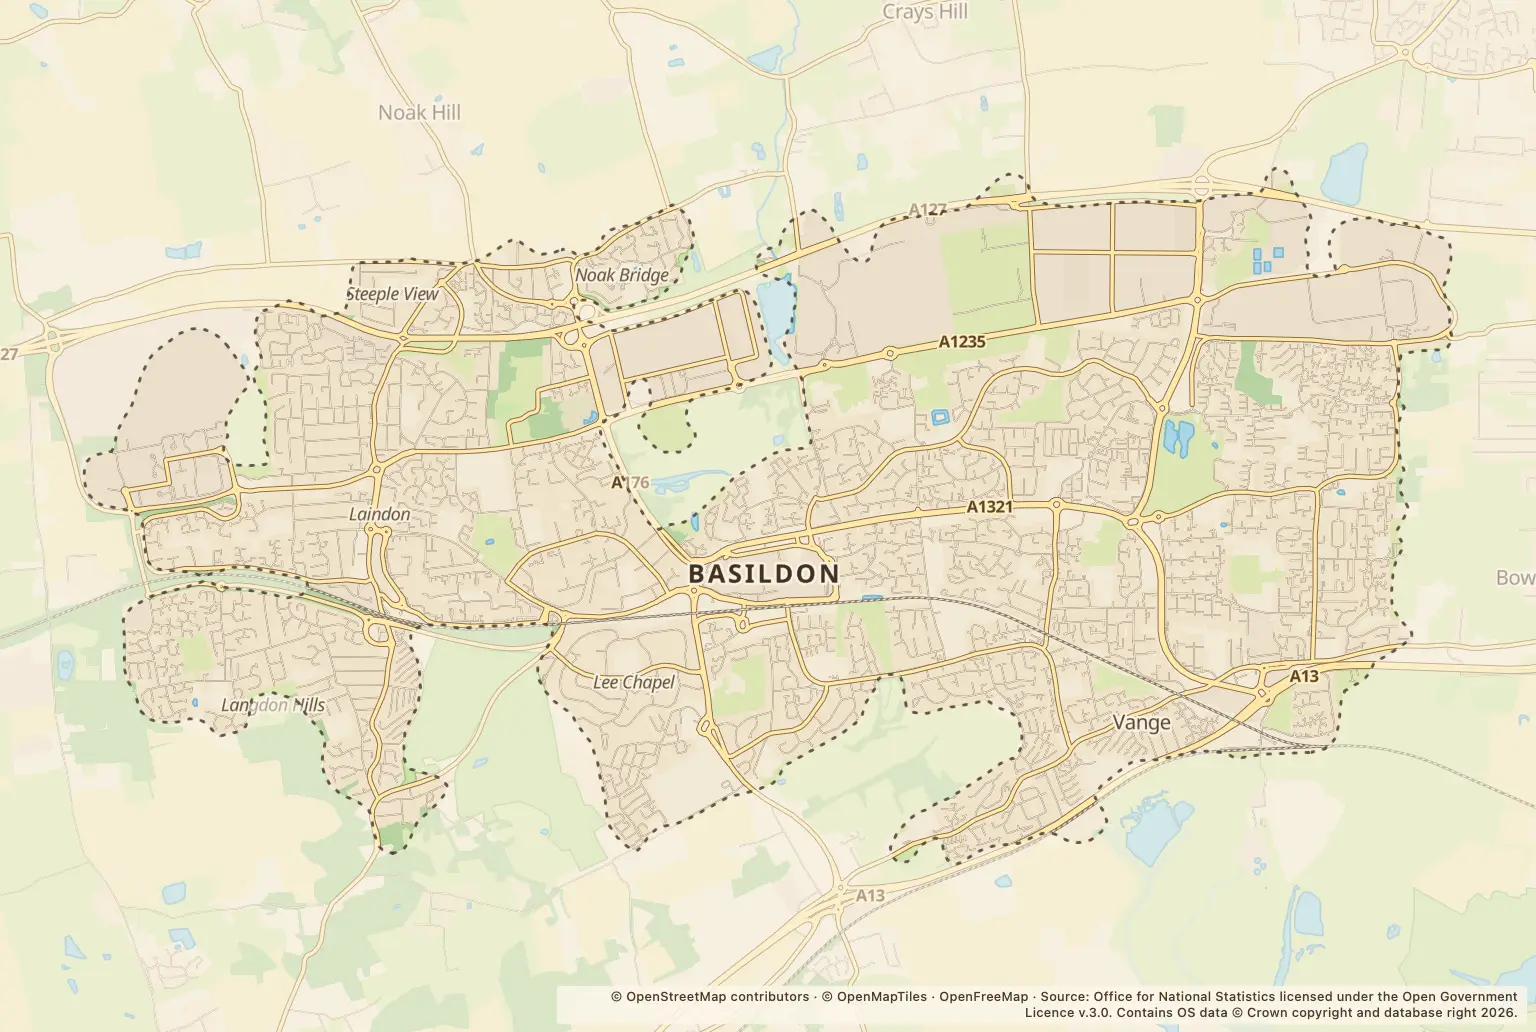
For anyone choosing a home in Basildon, the headline is that 15088 crimes were recorded in 2025. That is a count across the year, not a measure of the risk facing people in any one neighbourhood.
July was the busiest month, with 1428 recorded crimes. The annual figures also show which categories made up the largest shares.
Which types of crime were recorded most often in Basildon?
| Crime category | Recorded count |
|---|---|
| Violence and sexual offences | 6024 |
| Anti-social behaviour | 1544 |
| Criminal damage and arson | 1263 |
| Vehicle crime | 1162 |
| Shoplifting | 1157 |
| Public order | 1052 |
| Other theft | 941 |
| Drugs | 655 |
| Burglary | 478 |
| Other crime | 331 |
| Possession of weapons | 165 |
| Robbery | 161 |
| Theft from the person | 86 |
| Bicycle theft | 69 |
Source: police.uk, Street-level crime, January to December 2025.
When were recorded crime figures highest in Basildon?
July 2025 had 1428 recorded crimes, the highest monthly total in the figures. February 2025 had 1045. Monthly counts can help show when recorded crime was busier, but they do not explain why the numbers changed or show whether a particular street was affected.
Can I compare Basildon crime with other Essex towns?
These figures cover Basildon and provide no equivalent totals for neighbouring towns, the council area or Essex as a whole. They also do not include population figures, so they cannot show a crime rate or support a like-for-like comparison of risk.
How can I check crime near a home in Basildon?
Use the police.uk crime map and neighbourhood policing team to look at recorded crime around an area you are considering. Check more than one month and bear in mind that a town-wide annual total cannot describe conditions at a particular address.
About the figures
Police.uk’s Street-level crime figures cover January to December 2025. They count crimes recorded by police, rather than every incident that may have happened; the figures supplied do not state a publication date.