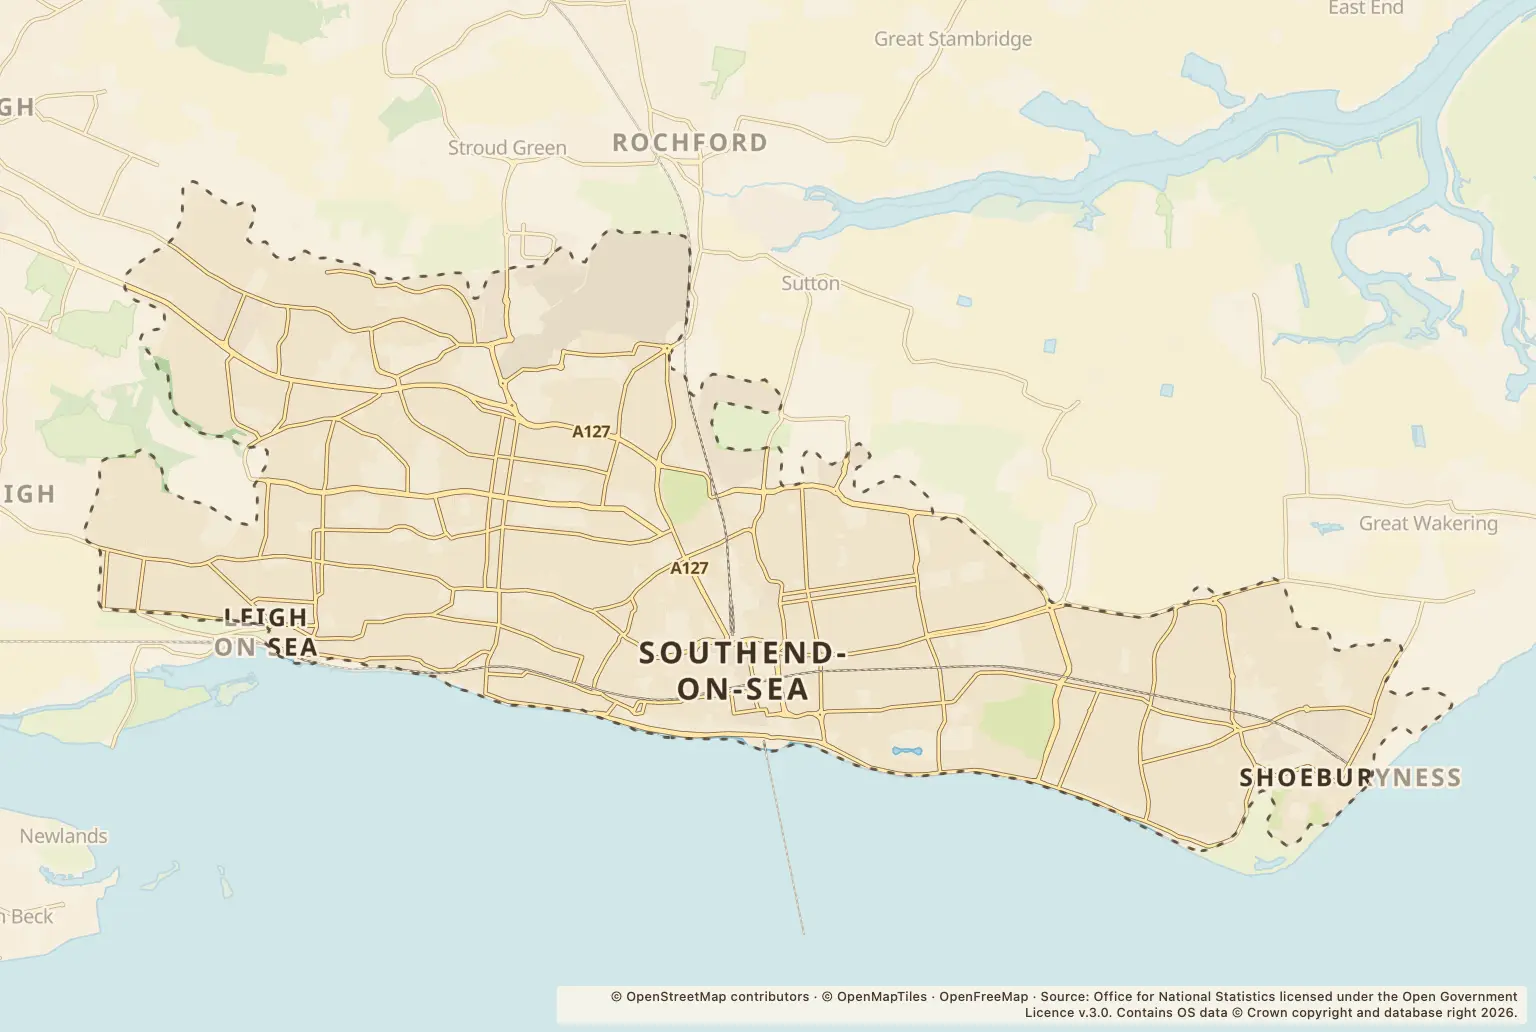
For people choosing a home in Southend-on-Sea, the headline figure is 20751 recorded crimes in 2025. It covers the town as a whole, not the risk at a particular street or home.
Violence and sexual offences made up the largest category, at 8735. The figures also show which other offences were recorded, but do not give a crime rate for comparison with neighbouring towns, Essex or the rest of the country.
Which crime types were recorded in Southend-on-Sea in 2025?
The figures cover a range of offences, from shoplifting and vehicle crime to burglary and robbery. The category counts are listed below.
When were most crimes recorded in Southend-on-Sea?
July was the busiest month, with 2094 recorded crimes. February had the lowest monthly total, at 1471. July 2025’s total was higher than July 2024’s 1763, while August 2025 recorded 1872 compared with 1854 in August 2024.
Monthly totals can help show how reported crime varied across the year, but they do not explain why the figures changed or indicate the risk to an individual household.
What do Southend-on-Sea’s crime figures tell home movers?
The category breakdown shows that violence and sexual offences were the largest group, followed by shoplifting and anti-social behaviour. It does not show where in Southend each offence happened, whether offences affected residents or visitors, or how many went unreported.
The figures are counts, not rates adjusted for population. They cannot establish whether Southend has more crime per resident than nearby places or Essex.
How can I check crime near a home in Southend-on-Sea?
Use the police.uk crime map and neighbourhood policing team to check recorded crime around an area you are considering and find local neighbourhood policing information. Look at the map alongside a visit to the area; the town-wide annual total cannot tell you what a particular street is like.
About the figures
Police.uk’s Street-level crime figures cover 2025. The supplied figures do not state a publication date. Recorded crime counts offences logged by police; they are not a complete measure of all crime and do not provide a population-based rate.