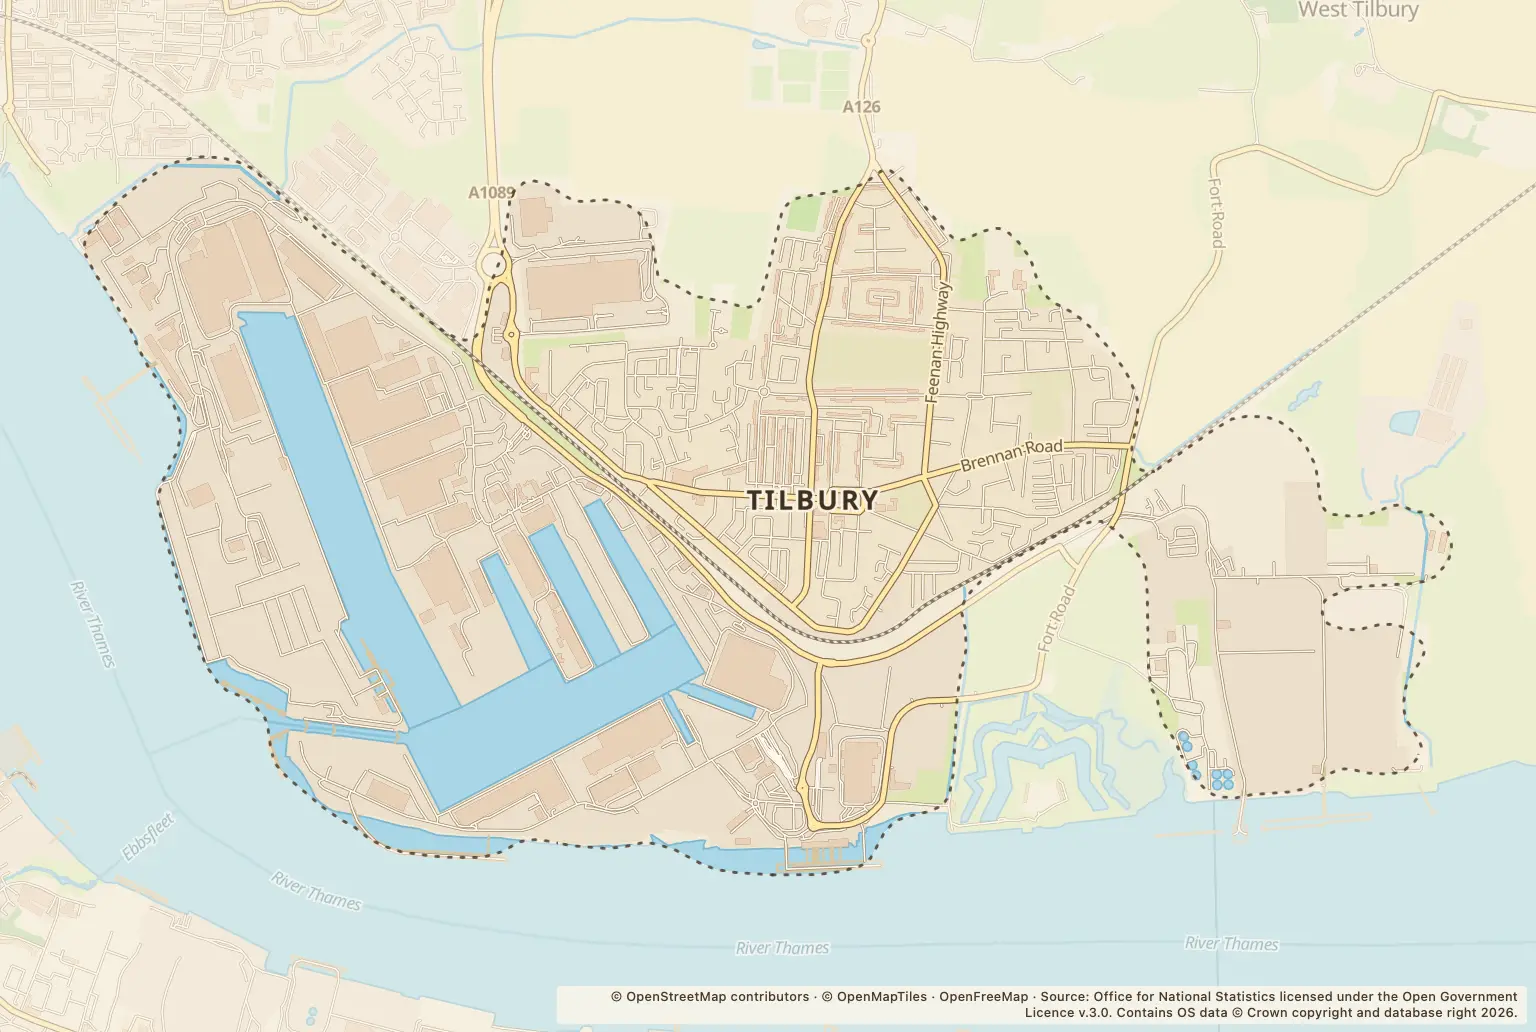
Tilbury had 151 recorded crimes in September 2026, down 17% from 181 in September 2025. For people choosing a home, that is a lower monthly count than a year earlier, but it does not show the risk at any one address.
Violence and sexual offences remained the largest category, with 55 recorded, compared with 56 a year earlier. Anti-social behaviour was unchanged at 19.
Which crime types changed most in Tilbury?
The overall fall sits alongside rises in some categories. Drugs offences increased from 3 to 8, and other theft from 9 to 16. Vehicle crime fell from 29 to 12.
| Crime type | September 2026 | September 2025 | Change |
|---|---|---|---|
| Violence and sexual offences | 55 | 56 | down 2% |
| Anti-social behaviour | 19 | 19 | unchanged |
| Criminal damage and arson | 16 | 28 | down 43% |
| Burglary | 3 | 9 | down 67% |
| Drugs | 8 | 3 | up 167% |
| Other theft | 16 | 9 | up 78% |
| Public order | 14 | 10 | up 40% |
| Vehicle crime | 12 | 29 | down 59% |
| Shoplifting | 5 | 11 | down 55% |
| Robbery | 0 | 4 | down 100% |
| Possession of weapons | 1 | 1 | unchanged |
| Theft from the person | 1 | 0 | — |
| Other crime | 1 | 2 | down 50% |
Source: police.uk street-level crime figures for September 2026, compared with September 2025.
How have Tilbury’s monthly crime figures moved?
The September total of 151 was below the 168 recorded in August 2026 and the 211 recorded in July 2026. April 2026 had 256 recorded crimes, the highest monthly total among the 2026 figures listed here.
A single month can move up or down, so the year-on-year comparison gives a different view from the recent month-to-month figures. Neither tells you how likely a particular home or journey is to be affected.
Which Tilbury streets and places had the most reports?
In September, the largest location counts were at a parking area and a supermarket, followed by Hobart Road and Windrush Road. These are reported locations, not counts tied to a particular home.
| Location | Reports in September 2026 |
|---|---|
| Parking Area | 14 |
| Supermarket | 12 |
| Hobart Road | 9 |
| Windrush Road | 8 |
| Civic Square | 5 |
Source: police.uk street-level crime figures for Tilbury in September 2026. Locations are approximate and describe where police placed reports.
Can Tilbury’s crime figures be compared with nearby areas?
Essex Police’s neighbourhood dashboard groups Chadwell St Mary and Tilbury together and lists 310 reports for September 2026. That covers a wider area than Tilbury alone, so it is not a like-for-like comparison with Tilbury’s 151. The figures here do not provide a comparable rate for Thurrock or Essex.
How can I check crime around a home in Tilbury?
Use the police.uk crime map and neighbourhood policing team to check reports around the roads you are considering, and look at more than one month. When viewing a home, check the route to local facilities and transport for yourself, and ask the landlord or agent about any concerns specific to the property.
About the figures
police.uk publishes street-level recorded crime figures. This report compares September 2026 with September 2025 and uses monthly figures for context. The release does not state a publication date. Recorded reports are not convictions or a count of every incident, and the figures do not show the time of day or give a crime rate for individual streets.