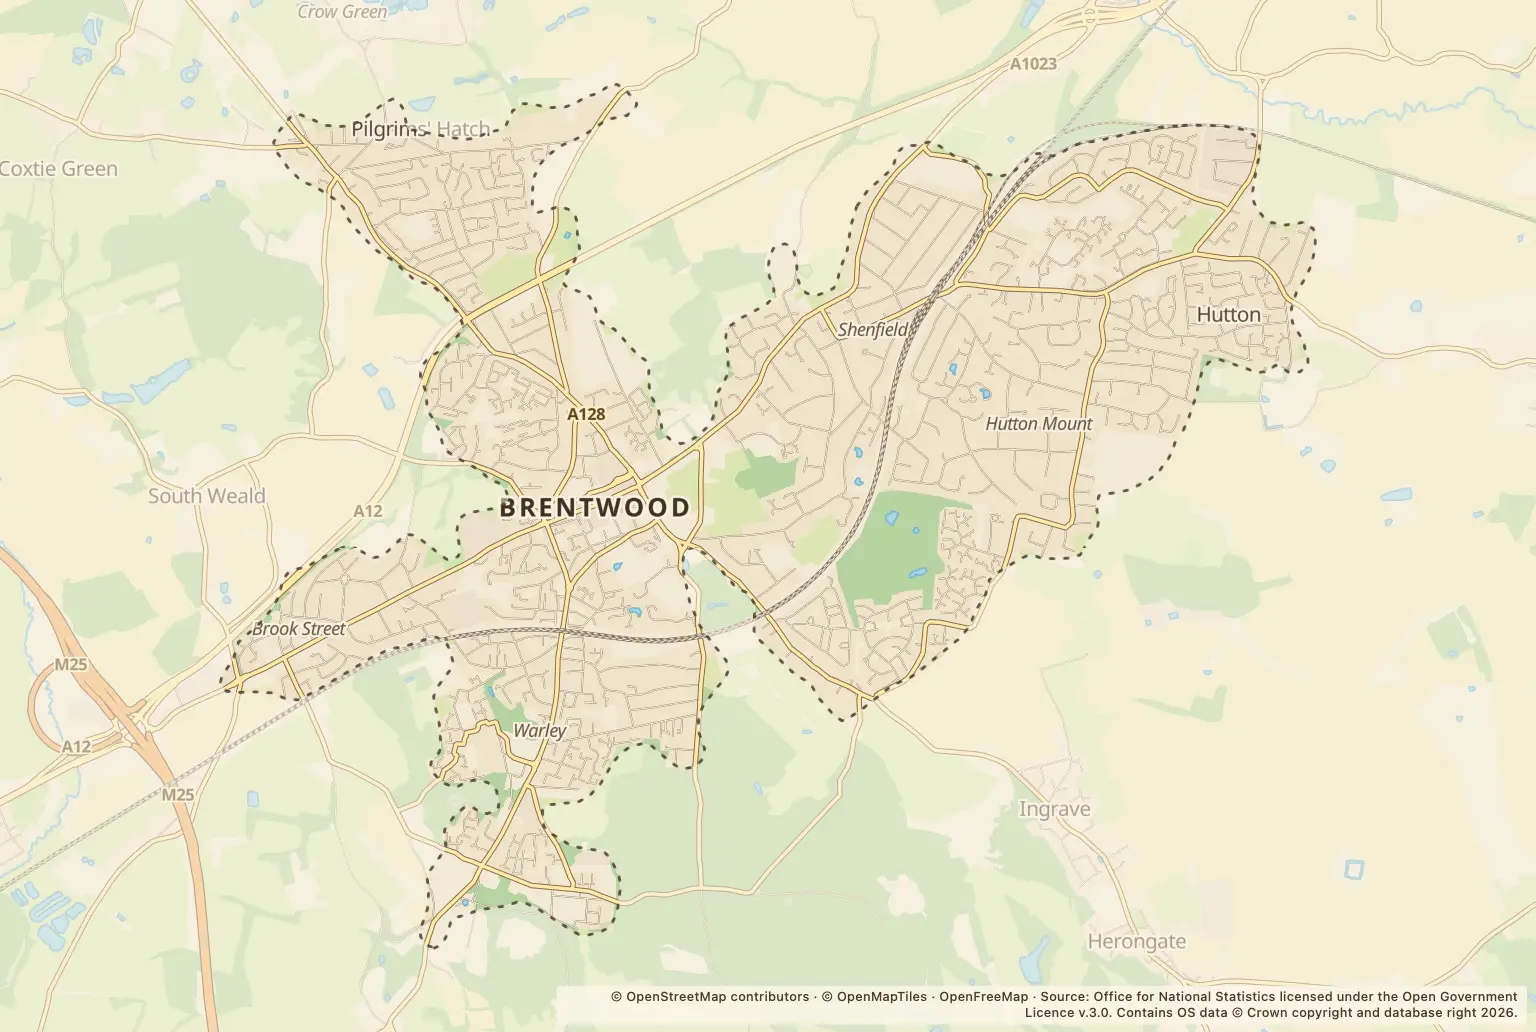
For anyone weighing up a move to Brentwood, September’s figures show a broadly steady overall count, but a rise in one category worth noting: 391 reports, compared with 396 in September 2025.
Violence and sexual offences were the largest category, with 140 reports. Shoplifting accounted for 56 and vehicle crime for 42.
How did Brentwood crime figures change from last year?
The total was down 1% on September 2025. It was also lower than August 2026, when police recorded 414 reports. That month-to-month comparison is a snapshot, not evidence of a longer-term trend.
Anti-social behaviour rose from 23 to 34 reports year on year. The percentage increase looks large beside the counts: bicycle theft also rose 100%, but that was from 1 report to 2.
Which types of crime were most common in Brentwood?
Violence and sexual offences were the biggest category, followed by shoplifting and vehicle crime. The table shows how each category compared with September 2025.
Where were reports recorded in Brentwood?
The highest location counts included broad place labels as well as named roads. A “Parking Area” or “Supermarket” is not a street, so these figures should not be read as a comparison of residential streets or as a measure of risk to residents.
How can I check crime near a Brentwood home?
Use the police.uk crime map and neighbourhood policing team to check the area around a property and see how reports are mapped. Compare the same months and categories when looking at different places; these counts do not show a crime rate, unreported offences or the likelihood of an incident affecting an individual.
About the figures
Police.uk’s Street-level crime figures cover September 2026, with September 2025 used for the year-on-year comparison. The publication date is not stated. Counts are reports recorded by police, not a measure of all offences that occurred; small starting numbers can also make percentage changes look pronounced.