Harwich recorded 248 crimes in September 2026, up 43% from 173 in September 2025. For people comparing places to live, this is a town-wide monthly count, not a crime rate for a particular street or home.
Which crime types were recorded in Harwich in September 2026?
Violence and sexual offences made up the largest category: 128, compared with 75 a year earlier. Anti-social behaviour rose from 22 to 33. Drugs offences increased from 1 to 7, a large percentage rise from a small number of reports.
Not every category increased. Shoplifting fell from 22 to 17, public order offences from 14 to 10, and robbery from 4 to 1. Criminal damage and arson stayed at 18.
How did September compare with recent months?
September’s 248 recorded crimes were fewer than in August, when there were 259, and July, when there were 253. The figure was higher than June’s 228. The year-on-year comparison is for the same month, while the monthly figures show that totals have varied during 2026.
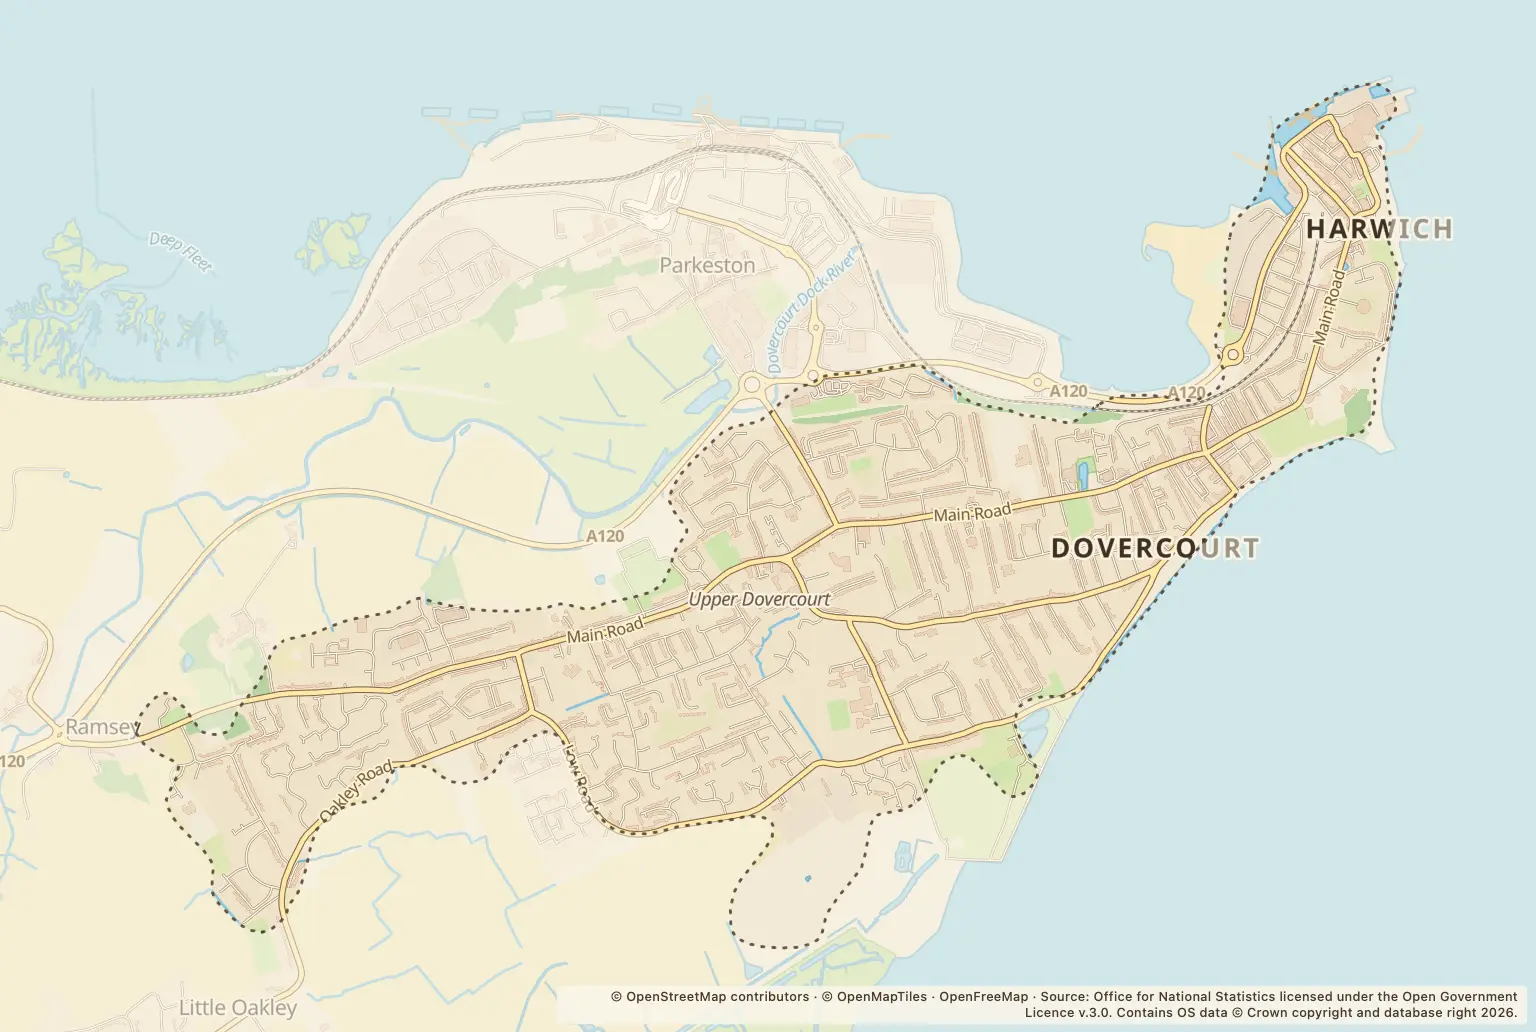
Where in Harwich were crimes recorded?
The street-level breakdown lists the location labelled Supermarket with 17 records. Church Street, Heron Way and St Edmunds Close each had 9. These are mapped locations, not a measure of the likelihood of crime at a particular home.
How can I check crime near a home in Harwich?
Use the police.uk crime map and neighbourhood policing team to check the area around a property and find local policing contacts. When comparing homes, bear in mind that town-wide monthly counts do not show a street-by-street rate or include crimes that were not reported.
About the figures
The figures are published by police.uk as street-level crime statistics and cover September 2026, with the year-on-year comparison against September 2025. The publication date is not stated. These are counts of recorded crimes, not population-adjusted rates; small category counts can also produce large percentage changes.