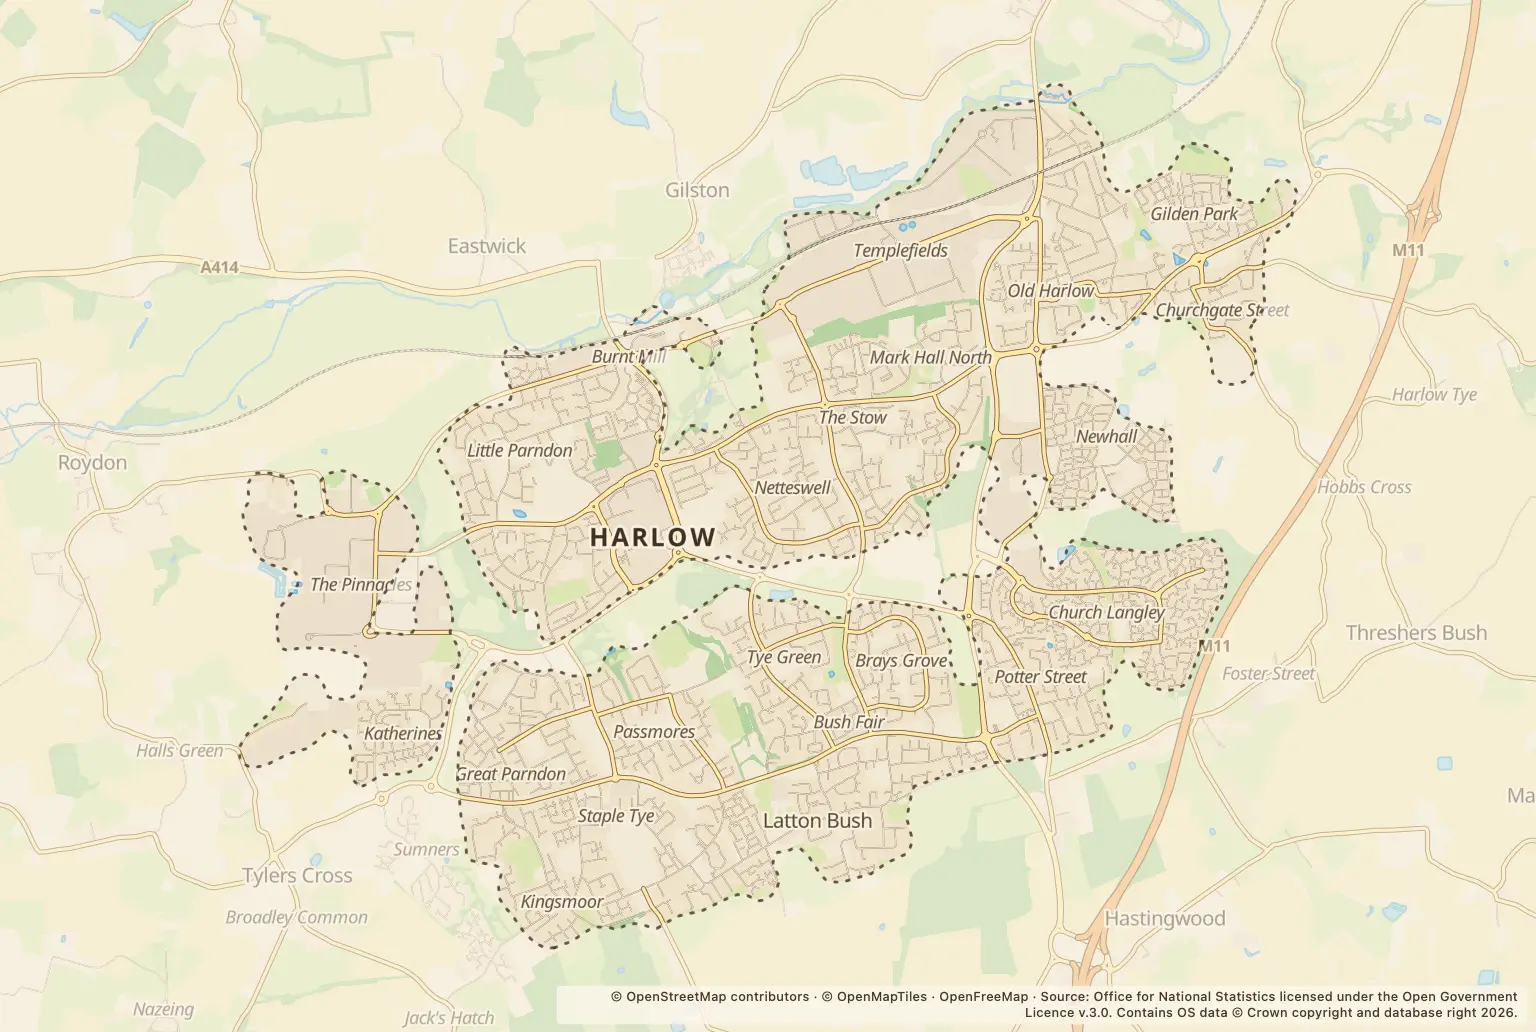
The September total was 1,036 recorded crimes, compared with 846 in September 2025. That is an annual rise of 22%, but the monthly total was lower than the 1,120 recorded in August 2026 and the 1,191 in July 2026.
For people weighing up a move, these figures give a town-wide snapshot, not a measure of the risk at a particular home. They count offences recorded by police, and do not show how many people live in each area.
How does Harlow’s September crime total compare with Essex?
The Seax reported 14,592 recorded crimes and anti-social behaviour incidents across Essex in September 2026. That is a county-wide figure, so it is not a like-for-like comparison with the Harlow town total.
The year-on-year rise in Harlow sits alongside a lower total than in the two preceding months. Monthly counts can move up and down; the September figure alone does not show whether a longer-term trend is continuing.
Which crimes were most common in Harlow?
Violence and sexual offences were the largest category, with 409 recorded, up from 333 a year earlier. Shoplifting and anti-social behaviour each had 114 records; shoplifting was up 148% from 46, while anti-social behaviour was up 63% from 70.
The table shows the September count beside the equivalent figure a year earlier. Other theft rose from 53 to 72, while vehicle crime fell from 67 to 44. These are counts, not rates per resident.
| Crime type | September 2026 | September 2025 |
|---|---|---|
| Violence and sexual offences | 409 | 333 |
| Anti-social behaviour | 114 | 70 |
| Shoplifting | 114 | 46 |
| Public order | 76 | 78 |
| Criminal damage and arson | 71 | 76 |
| Other theft | 72 | 53 |
| Drugs | 49 | 40 |
| Vehicle crime | 44 | 67 |
| Burglary | 25 | 19 |
| Other crime | 25 | 19 |
| Robbery | 15 | 19 |
| Bicycle theft | 12 | 4 |
| Possession of weapons | 5 | 14 |
| Theft from the person | 5 | 8 |
Source: Police.uk, Street-level crime, September 2026 and September 2025.
Which Harlow locations had the most recorded crimes?
In the September listing, the labels with the highest counts were Supermarket, with 87, and Parking Area, with 47. Hospital had 30, Petrol Station 28 and Shopping Area 22.
These are location labels in the street-level listing, not a ranking of residential neighbourhoods. The figures do not account for how many people visit or live in each place, so they should not be read as a crime rate or a guide to the risk at a nearby home.
How can you check crime near a home in Harlow?
Use the police.uk crime map and neighbourhood policing team service to check the area around a property and see the categories and locations shown there. Check the dates as well as the counts, and compare the same months if you are looking for a trend.
For a moving decision, treat the town-wide total as background. Check the specific neighbourhood and property, then consider other factors such as schools, transport and any planned building.
About the figures
Police.uk publishes the street-level crime figures. The totals and category counts here cover September 2026, with September 2025 used for the year-on-year comparison; the monthly totals for July and August 2026 are also included for context. The figures describe crimes recorded by police, not every crime that may have taken place, and no population-based crime rate is supplied for this town-level snapshot.