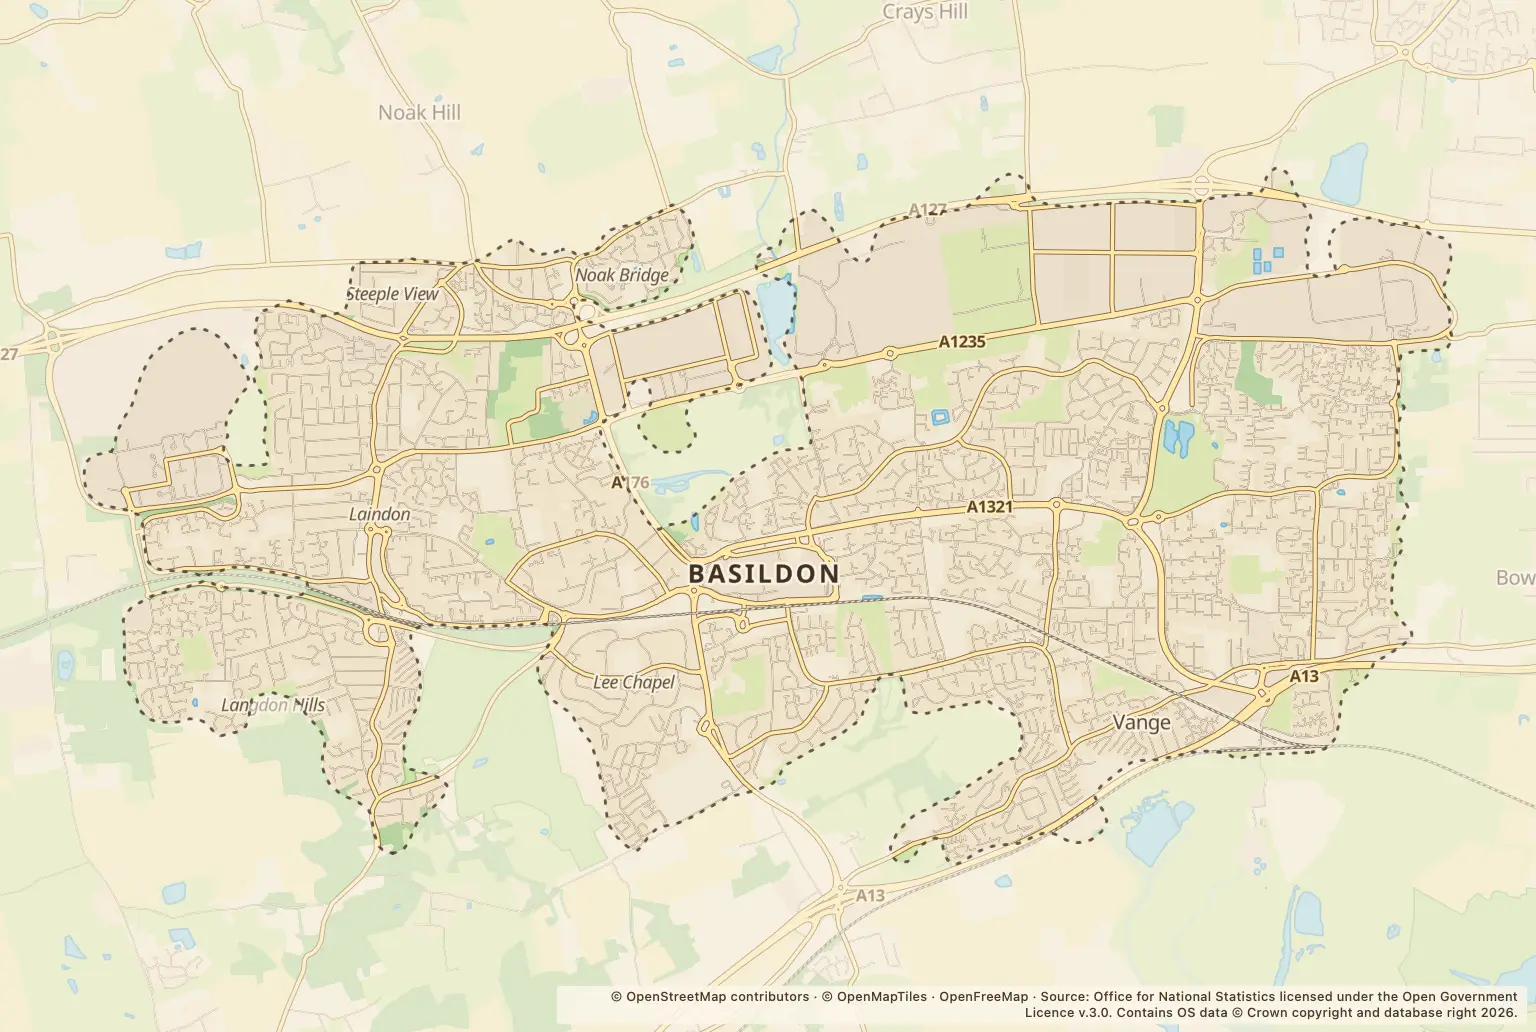
For people choosing a home in Basildon, the latest figures show a rise in recorded crime, led by a sharp increase in anti-social behaviour. The total was 1317 in September 2026, compared with 1216 in September 2025.
Which types of crime increased in Basildon?
| Crime type | September 2026 | September 2025 | Change |
|---|---|---|---|
| Anti-social behaviour | 199 | 105 | up 90% |
| Bicycle theft | 7 | 8 | down 12% |
| Burglary | 28 | 32 | down 12% |
| Criminal damage and arson | 93 | 117 | down 21% |
| Drugs | 57 | 66 | down 14% |
| Other theft | 76 | 66 | up 15% |
| Possession of weapons | 17 | 10 | up 70% |
| Public order | 72 | 94 | down 23% |
| Robbery | 15 | 13 | up 15% |
| Shoplifting | 122 | 104 | up 17% |
| Theft from the person | 7 | 12 | down 42% |
| Vehicle crime | 82 | 94 | down 13% |
| Violence and sexual offences | 516 | 469 | up 10% |
| Other crime | 26 | 26 | unchanged |
Source: police.uk, recorded crime figures for September 2026 and September 2025.
Where were the most crime records mapped?
The highest counts among the listed location labels were Parking Area, with 59, and Petrol Station, with 43. Festival Way and Supermarket each had 38, while Hospital had 37.
These labels show where offences were mapped, not where victims live or the likelihood of crime at a particular home. They are not a like-for-like measure of neighbourhood safety; a busy public place and a residential street serve different numbers of people.
Can I compare Basildon with Essex or nearby towns?
These figures cover Basildon only, so they do not show whether its recorded crime was higher or lower than in neighbouring towns or across Essex. They are counts, not a crime rate adjusted for population, and cannot on their own tell a prospective buyer or renter the chance of being affected.
How can I check crime near a home in Basildon?
Search the police.uk crime map and neighbourhood policing team for the area you are considering. Check several nearby locations and months, and treat small counts cautiously; for a fuller decision, ask about the specific area and check other factors such as schools, transport and planned building.
About the figures
police.uk publishes the recorded-crime figures for September 2026, with September 2025 figures used for the year-on-year comparison. A publication date is not stated. These are recorded offences, not a measure of every crime that happened or a population-based crime rate; monthly counts can vary and do not establish an individual household’s risk.