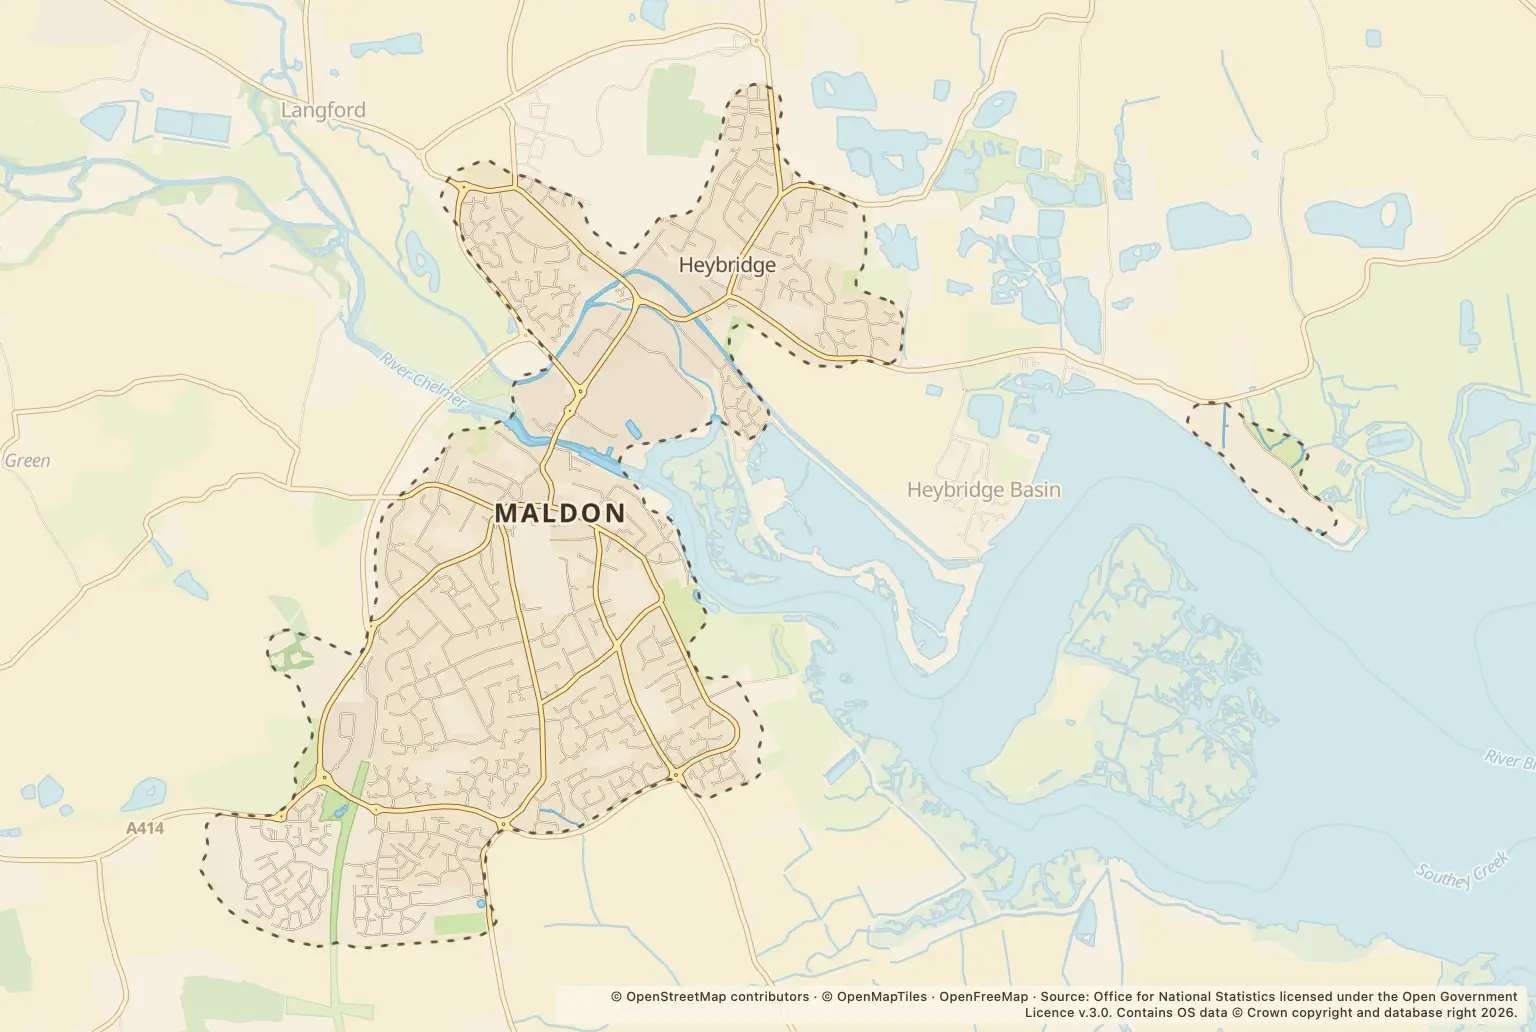
For anyone weighing up a move to Maldon, the headline figure is 1,635 recorded crimes in 2025. Violence and sexual offences accounted for 777 of them, more than any other category.
What do Maldon crime figures show about the types of offences?
The largest category was violence and sexual offences, with 777 recorded. Public order was next, at 141. The table gives the full breakdown.
| Crime type | Recorded crimes in 2025 |
|---|---|
| Violence and sexual offences | 777 |
| Public order | 141 |
| Criminal damage and arson | 125 |
| Anti-social behaviour | 115 |
| Shoplifting | 115 |
| Other theft | 107 |
| Drugs | 96 |
| Vehicle crime | 47 |
| Burglary | 41 |
| Other crime | 40 |
| Possession of weapons | 18 |
| Theft from the person | 6 |
| Bicycle theft | 4 |
| Robbery | 3 |
Source: police.uk Street-level crime figures for Maldon, January to December 2025.
Which months had the most recorded crime in Maldon?
July had the highest monthly total, with 178 recorded crimes. February had the lowest, with 94. Monthly counts show when offences were recorded, but do not explain why totals varied.
| Month | Recorded crimes |
|---|---|
| January | 130 |
| February | 94 |
| March | 119 |
| April | 140 |
| May | 135 |
| June | 155 |
| July | 178 |
| August | 152 |
| September | 143 |
| October | 127 |
| November | 125 |
| December | 137 |
Source: police.uk Street-level crime figures for Maldon, January to December 2025.
Can these figures show how safe a particular street or home is?
Not on their own. These are counts of crimes recorded by police, not a crime rate adjusted for population, and they do not measure the risk to an individual household. The figures also do not provide a like-for-like comparison with Maldon District or Essex, so they cannot show whether Maldon is higher or lower than those areas.
If you are considering a particular part of town, check the police.uk crime map and neighbourhood policing team for local information. For a move, it is also worth checking the details that matter to your household, such as schools, transport and any planned building.
About the figures
The figures are published by police.uk as Street-level crime statistics and cover the calendar year 2025. They count crimes recorded by police; they are not a measure of all crime or of an individual resident’s likelihood of becoming a victim. A publication date for this annual breakdown is not stated.