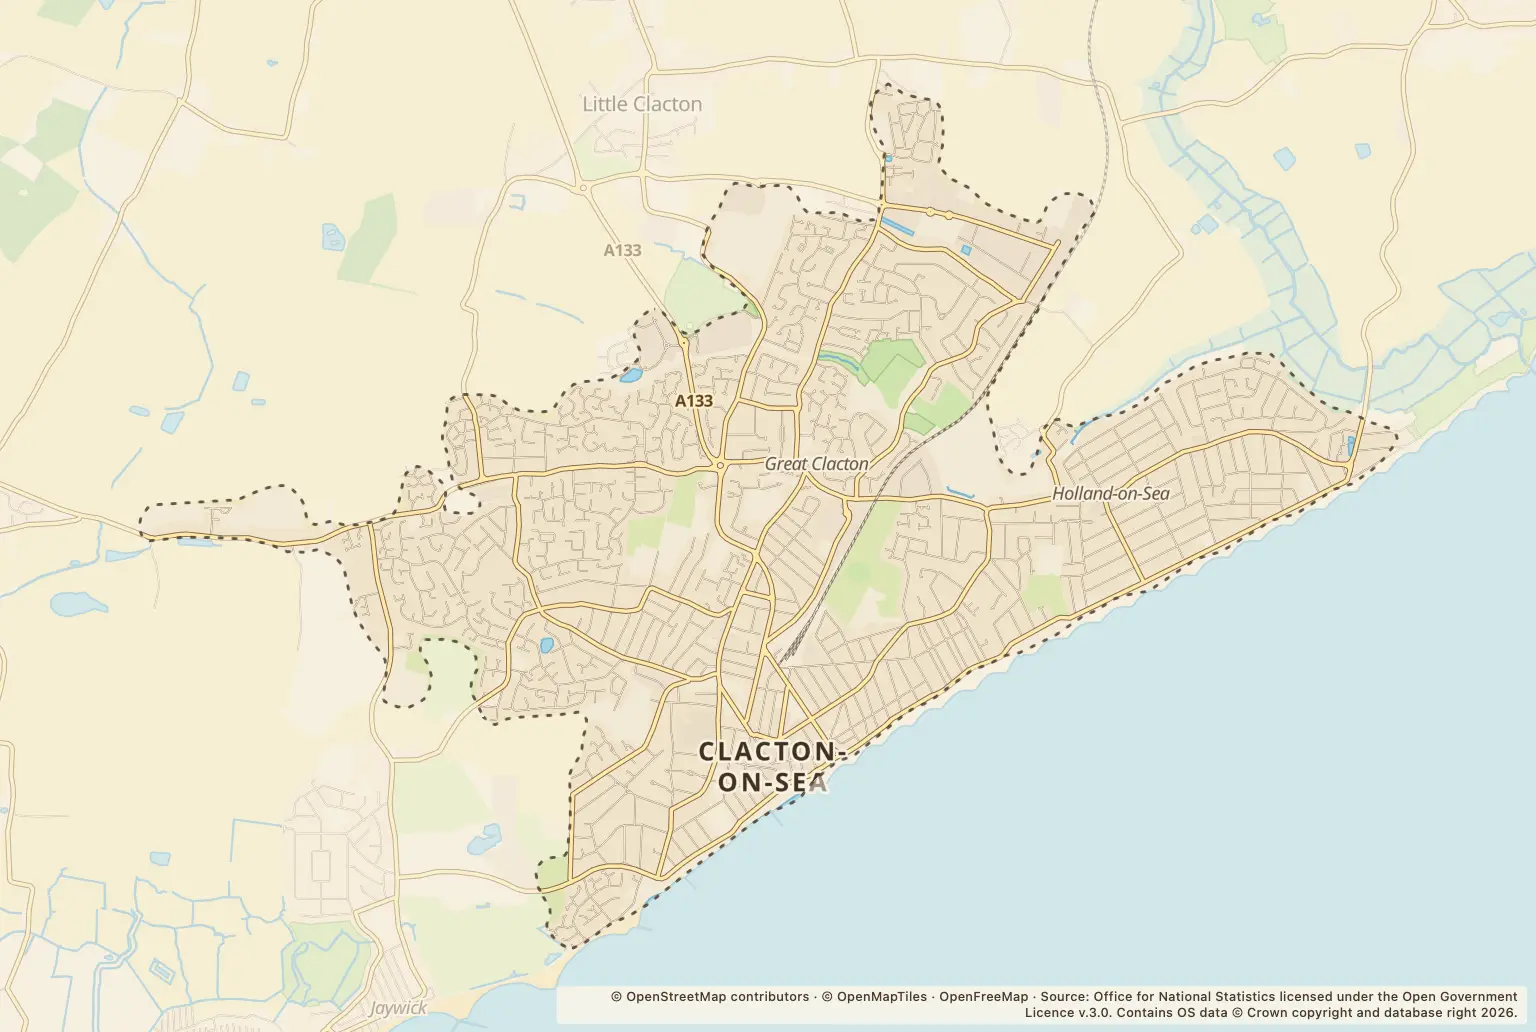
Police recorded 658 crimes in Clacton-on-Sea in September 2026, compared with 529 in September 2025 — an increase of 24%.
That is a useful snapshot for people comparing areas, but one month’s count cannot tell you how safe a particular street or home is.
Which crimes were recorded most often in Clacton-on-Sea?
Violence and sexual offences made up the largest category, with 312 records. Other theft rose from 29 to 55, while theft from the person rose from 2 to 12; the latter is a large percentage increase from a small starting number.
| Crime type | September 2026 | September 2025 and change |
|---|---|---|
| Anti-social behaviour | 73 | 53; up 38% |
| Bicycle theft | 1 | 4; down 75% |
| Burglary | 8 | 12; down 33% |
| Criminal damage and arson | 52 | 47; up 11% |
| Drugs | 14 | 20; down 30% |
| Other theft | 55 | 29; up 90% |
| Possession of weapons | 4 | 8; down 50% |
| Public order | 46 | 33; up 39% |
| Robbery | 11 | 9; up 22% |
| Shoplifting | 40 | 25; up 60% |
| Theft from the person | 12 | 2; up 500% |
| Vehicle crime | 14 | 10; up 40% |
| Violence and sexual offences | 312 | 265; up 18% |
| Other crime | 16 | 12; up 33% |
Source: police.uk recorded crime figures for September 2026 and September 2025.
The biggest percentage changes need context: theft from the person rose by 10 records, from 2 to 12, while other theft rose by 26, from 29 to 55. Counts and percentages describe recorded reports, not the circumstances behind them.
Which Clacton locations had the most recorded crime?
Police.uk’s September street-level breakdown lists these locations and settings most prominently:
| Location or setting | Records in September 2026 |
|---|---|
| Parking Area | 61 |
| Shopping Area | 50 |
| Petrol Station | 23 |
| Supermarket | 23 |
| B1369 | 12 |
| Pier Avenue | 11 |
Source: police.uk street-level crime figures for September 2026.
The first four entries are broad location labels, rather than residential streets. They should not be read as a measure of the risk to people living nearby.
How did September compare with recent months?
Police.uk recorded 794 crimes in August 2026 and 783 in July 2026, compared with 658 in September. September’s total was also higher than the 628 recorded in May, but lower than the 786 in June.
The year-on-year rise and the lower total than in the two preceding months describe different comparisons. Neither shows on its own whether crime is rising or falling over a longer period.
How can I check crime around a home or neighbourhood?
Use the police.uk crime map and neighbourhood policing team to look at reports around a specific area and find local neighbourhood policing details. Check more than one month, and bear in mind that recorded counts do not give a population-adjusted crime rate or cover every crime that may have happened.
About the figures
Police.uk publishes the recorded crime figures. The main comparison is September 2026 against September 2025; the monthly context covers July to September 2026 and May to June 2026. The publication date is not stated. These are counts of crimes recorded by police, not a measure of individual risk, and the figures do not explain the circumstances of each report.