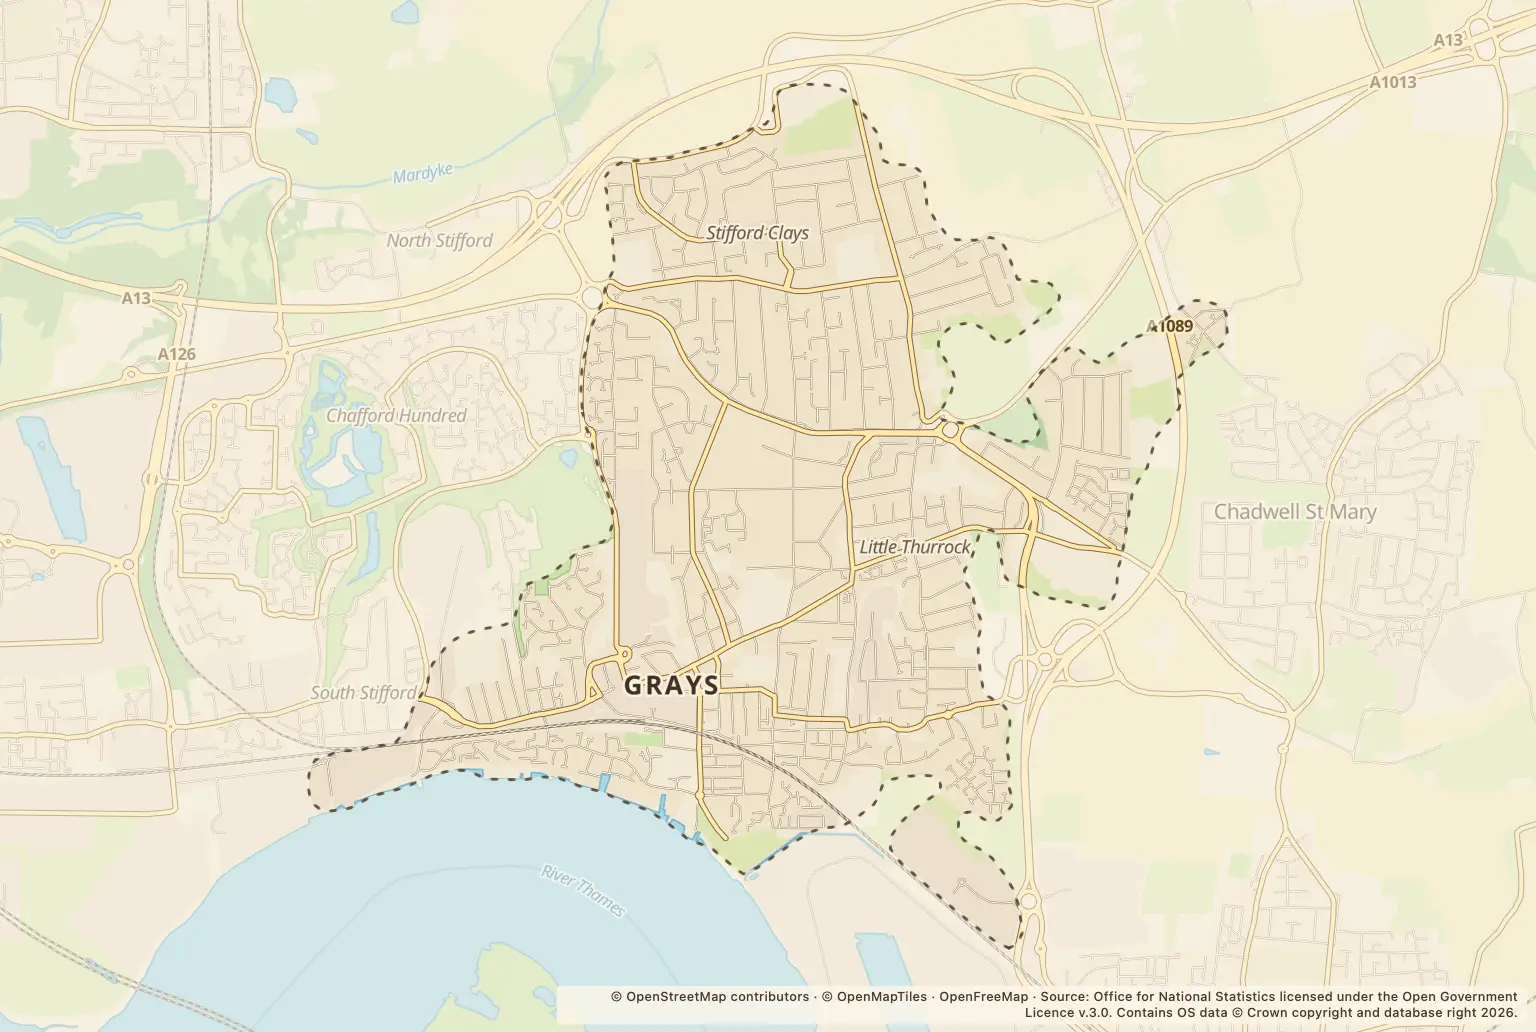
Grays had 5109 recorded crimes in 2025. For anyone choosing where to live, that is a town-wide count, not a measure of the risk at a particular home or street.
Which crime types were most common in Grays in 2025?
Violence and sexual offences were the largest category, at 1787. Shoplifting followed with 611, then anti-social behaviour with 448. Vehicle crime was close behind at 447, while criminal damage and arson accounted for 437.
The other recorded categories were public order (388), other theft (349), drugs (242), burglary (123), other crime (94), robbery (50), bicycle theft (49), possession of weapons (44) and theft from the person (40).
How did recorded crime vary by month in Grays?
March was the busiest month, with 480 recorded crimes. February had 371. The monthly figures show variation across the year, so the annual total alone does not describe how reports were distributed month by month.
| Month | Recorded crimes |
|---|---|
| January 2025 | 432 |
| February 2025 | 371 |
| March 2025 | 480 |
| April 2025 | 425 |
| May 2025 | 411 |
| June 2025 | 426 |
| July 2025 | 425 |
| August 2025 | 466 |
| September 2025 | 432 |
| October 2025 | 403 |
| November 2025 | 448 |
| December 2025 | 390 |
Source: Police.uk street-level crime figures for Grays, January to December 2025.
What should you check before choosing a home in Grays?
The annual count does not give a crime rate or compare Grays with Thurrock or Essex. It also cannot show the likelihood of crime at an individual address. Counts are not a substitute for checking the neighbourhood you are considering.
Look at the police.uk crime map and neighbourhood policing team for the areas around a home you are viewing. Check the types of crime and the months shown, and remember that recorded offences are not a complete measure of safety.
About the figures
Police.uk’s street-level crime figures show crimes recorded in Grays during 2025. The figures do not state a publication date. They are counts, not population-adjusted rates, and do not show unreported crime or allow a direct comparison with Thurrock or Essex.