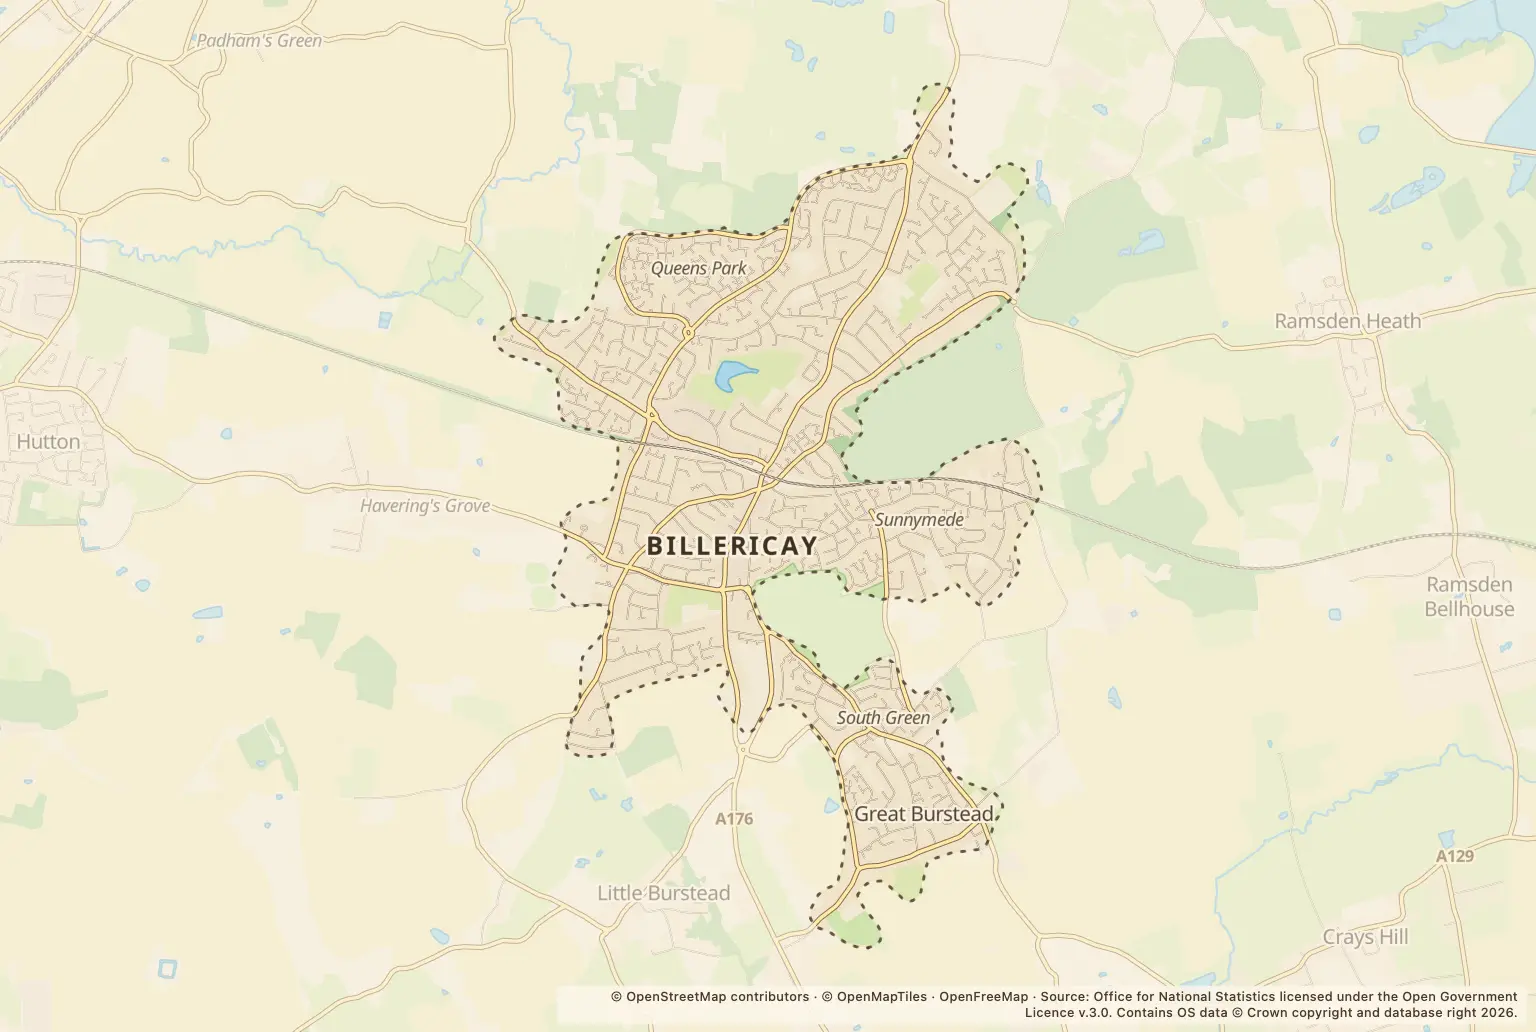
For anyone weighing up a move to Billericay, the headline is 1512 recorded crimes in 2025. That is a count for the town, not the chance that a particular resident or household will be affected.
The type of offence and when it was recorded add useful detail. March had the highest monthly total, while violence and sexual offences were the biggest category across the year.
What types of crime were recorded in Billericay in 2025?
Violence and sexual offences accounted for the largest number, at 557. Shoplifting was next, with 232, followed by vehicle crime with 129. The remaining categories are set out below.
| Crime type | Recorded offences |
|---|---|
| Violence and sexual offences | 557 |
| Shoplifting | 232 |
| Vehicle crime | 129 |
| Anti-social behaviour | 111 |
| Other theft | 104 |
| Criminal damage and arson | 93 |
| Public order | 91 |
| Burglary | 75 |
| Drugs | 52 |
| Other crime | 42 |
| Theft from the person | 12 |
| Robbery | 6 |
| Possession of weapons | 5 |
| Bicycle theft | 3 |
Source: police.uk street-level crime figures for Billericay, January to December 2025.
These counts show which categories were most frequently recorded, not where people are most likely to be affected. The figures do not include a population-based crime rate or comparable totals for nearby towns, Basildon district or Essex, so they cannot show how Billericay compares with those places.
When were the most crimes recorded in Billericay?
March was the busiest month, with 167 recorded crimes. April had the lowest monthly total, with 94. Monthly counts can help readers see how the annual total was spread across the year, but they do not explain why numbers rose or fell.
| Month in 2025 | Recorded crimes |
|---|---|
| January | 107 |
| February | 98 |
| March | 167 |
| April | 94 |
| May | 111 |
| June | 120 |
| July | 135 |
| August | 156 |
| September | 141 |
| October | 123 |
| November | 135 |
| December | 125 |
Source: police.uk street-level crime figures for Billericay, January to December 2025.
The March figures include 63 shoplifting offences, and the location list records 62 offences at a place labelled “Supermarket”. That label does not identify a particular shop, so it should not be read as evidence about one named business or a residential street.
Can these figures tell me how safe a particular Billericay area is?
Not on their own. They are town-wide offence counts, and the figures shown here do not provide a crime rate, a population denominator or a comparable breakdown for neighbouring places. Nor do they show whether an individual home or road is safer than another.
Before choosing a property, check the police.uk crime map and neighbourhood policing team for the area you are considering. You can also look at the types and locations of offences there, while keeping in mind that a recorded count is not a prediction of what will happen at a particular address.
About the figures
Police.uk publishes the recorded street-level crime figures used here. They cover January to December 2025; a publication date is not given. These are recorded offence counts, not a crime rate, and the figures do not show all crime or establish the likelihood of crime affecting an individual household.