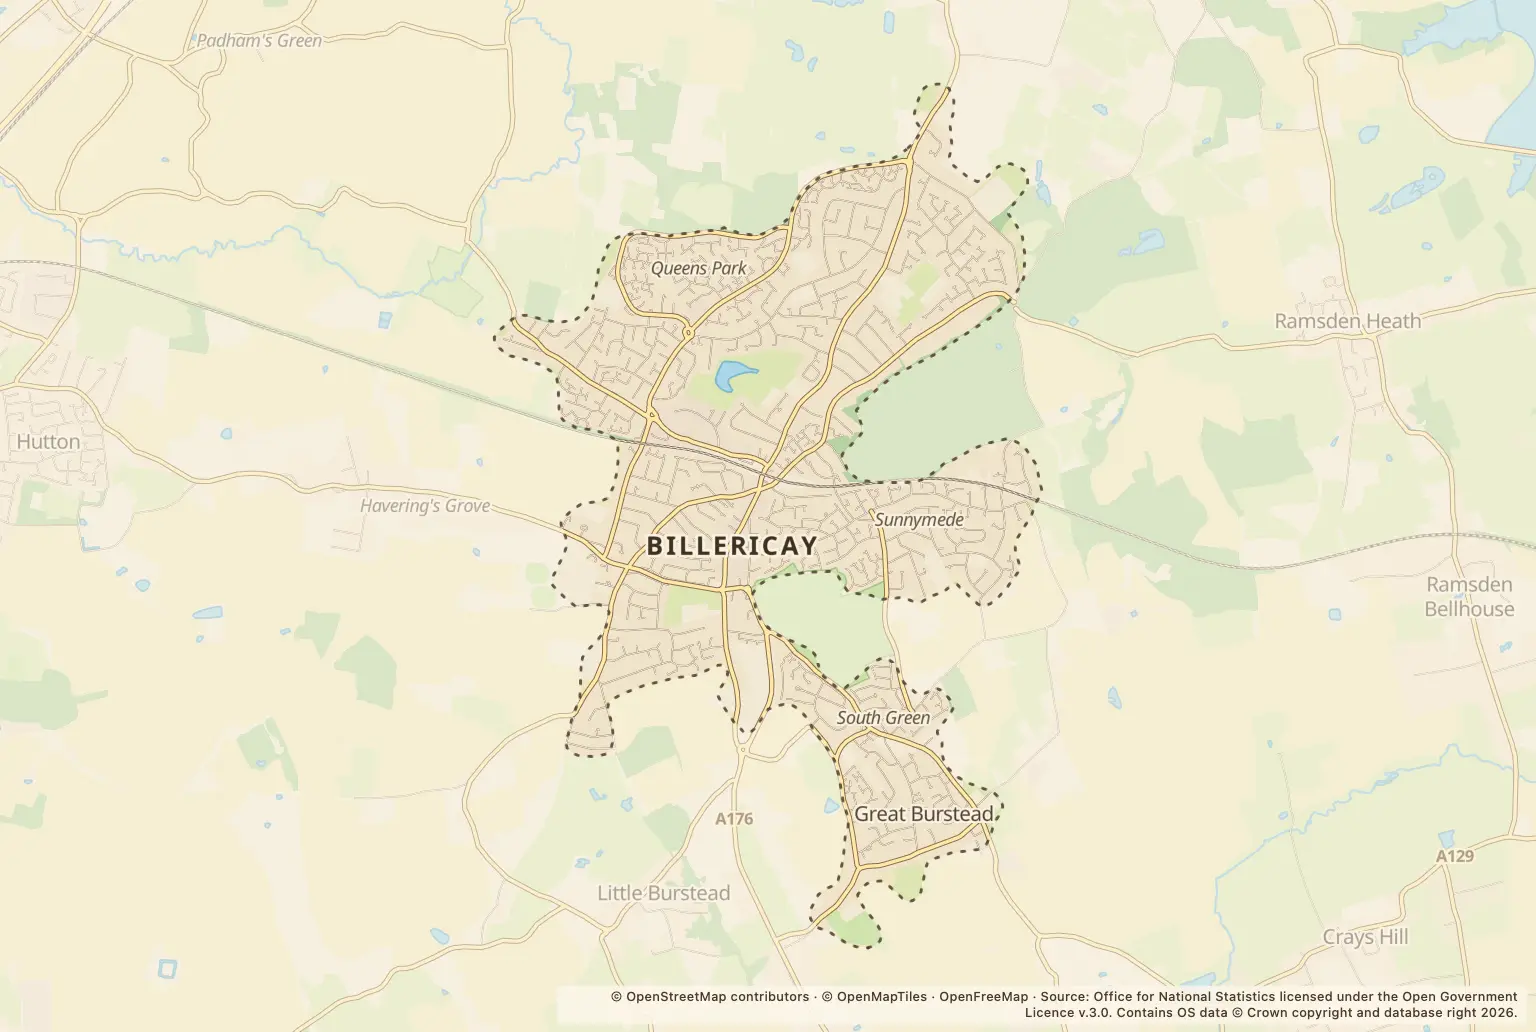
Police recorded 152 crimes in Billericay in September 2026, up 8% from 141 in September 2025. The figures count recorded offences, not the chance of crime for an individual household.
Violence and sexual offences remained the largest category, with 60 recorded. Anti-social behaviour rose from 15 to 25, and burglary from 2 to 8.
Which crimes increased in Billericay?
| Crime category | September 2026 | September 2025 | Change |
|---|---|---|---|
| Violence and sexual offences | 60 | 54 | Up 11% |
| Anti-social behaviour | 25 | 15 | Up 67% |
| Vehicle crime | 14 | 13 | Up 8% |
| Public order | 11 | 10 | Up 10% |
| Burglary | 8 | 2 | Up 300% |
| Other theft | 7 | 7 | Unchanged |
| Criminal damage and arson | 5 | 7 | Down 29% |
| Drugs | 5 | 5 | Unchanged |
| Other crime | 4 | 4 | Unchanged |
| Robbery | 1 | 0 | One recorded; none a year earlier |
| Possession of weapons | 1 | 2 | Down 50% |
| Shoplifting | 11 | 22 | Down 50% |
| Bicycle theft | 0 | 0 | None recorded in either month |
| Theft from the person | 0 | 0 | None recorded in either month |
Source: police.uk street-level crime figures for September 2026, compared with September 2025.
The burglary rise is a large percentage change, but the count moved from 2 to 8. That small starting number matters when judging the change. Shoplifting moved in the other direction, from 22 to 11.
How does September compare with recent months?
Billericay recorded 152 crimes in September 2026, compared with 112 in August 2026 and 145 in July 2026. September was also above the 141 recorded in September 2025.
Monthly totals can move around, so these figures alone do not show whether crime is rising over a longer period. They also do not adjust for the number of people living in or visiting Billericay.
Where were crimes recorded in Billericay?
- Supermarket: 9
- Ganels Road: 6
- Parking Area: 5
These are the highest counts among the locations listed for September. A count for a location does not show the risk to nearby residents: the figures do not account for how many people use each place or how much time they spend there.
How can I check crime near a home in Billericay?
If you are choosing a home or checking your neighbourhood, use the police.uk crime map and neighbourhood policing team to look at nearby locations and crime categories. Compare more than one month, and remember that a street-level count is not a crime rate for residents.
About the figures
Police.uk publishes the street-level figures. This report covers September 2026 and compares it with September 2025; the publication date is not stated. The figures are recorded-crime counts, not a rate per resident, and small category totals can change sharply between months. No comparable figures for neighbouring towns, the council area or Essex are included here.