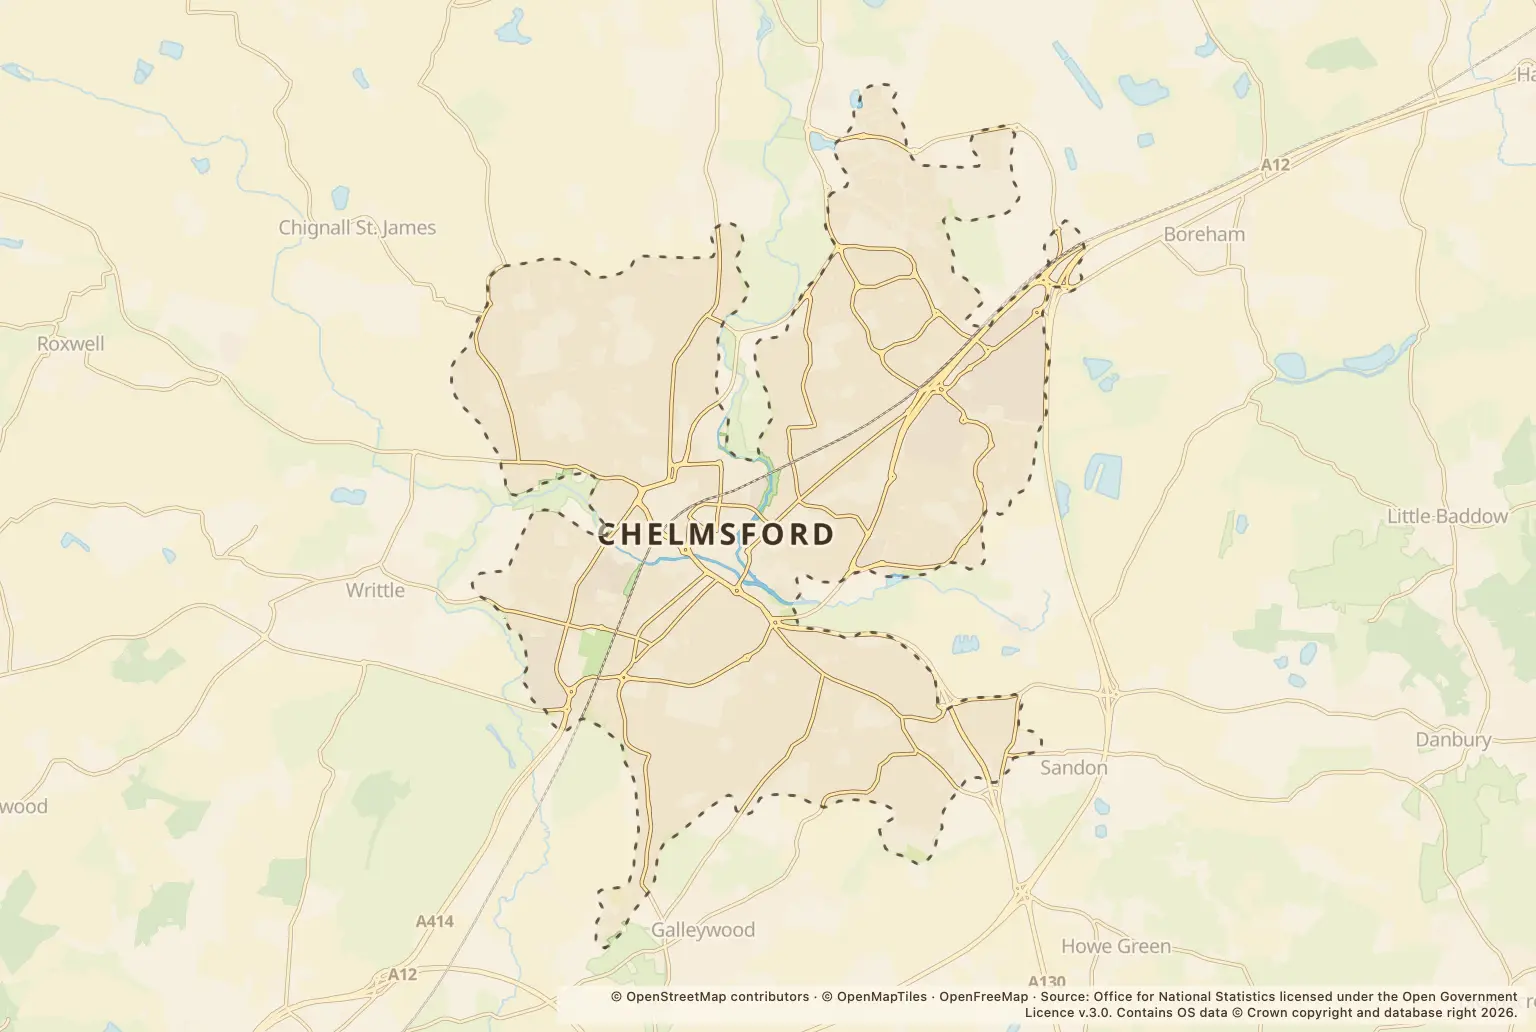
Chelmsford recorded 1039 crimes in September 2026, up 8% on September 2025, when the total was 958.
The overall rise sits alongside a mixed picture: anti-social behaviour and burglary increased, while shoplifting and public order offences fell.
Which types of crime increased in Chelmsford?
Anti-social behaviour had the sharpest percentage rise, increasing 116% to 134 from 62. Burglary rose 83%, from 18 to 33, and vehicle crime rose 48%, from 31 to 46.
The largest category was violence and sexual offences, with 399 recorded, compared with 398 a year earlier. Shoplifting fell to 110 from 140, while public order offences fell to 62 from 74.
How do Chelmsford’s September figures compare with other months?
The September total was below the 1209 recorded in August 2026 and the 1219 recorded in July 2026. But it was higher than the 958 recorded in September 2025.
Month-to-month totals can move in different directions from the year-on-year comparison. The figures do not explain why the changes happened.
What were the recorded crime counts by type?
| Category | September 2026 | September 2025 |
|---|---|---|
| Anti-social behaviour | 134 | 62 |
| Bicycle theft | 16 | 12 |
| Burglary | 33 | 18 |
| Criminal damage and arson | 56 | 59 |
| Drugs | 61 | 56 |
| Other theft | 73 | 59 |
| Possession of weapons | 15 | 12 |
| Public order | 62 | 74 |
| Robbery | 3 | 7 |
| Shoplifting | 110 | 140 |
| Theft from the person | 14 | 7 |
| Vehicle crime | 46 | 31 |
| Violence and sexual offences | 399 | 398 |
| Other crime | 17 | 23 |
Source: police.uk street-level crime figures for September 2026, with September 2025 comparisons.
Do these figures show which Chelmsford neighbourhood is safest?
No. The total covers Chelmsford as a whole and does not give a population-based crime rate or a comparable figure for neighbouring towns, the council area or Essex. It cannot show how the risk differs between homes or neighbourhoods.
The location labels for September included Parking Area, with 77 records, Nightclub with 62, Shopping Area with 57 and Supermarket with 56. These place-level counts can help when checking an area, but they do not show what happened at a particular home.
How can I check crime near a home in Chelmsford?
If you are considering a move, check the police.uk crime map and neighbourhood policing team for the area around a property. Compare nearby locations and the types of reports, rather than treating the townwide total as a measure of risk at one address.
About the figures
police.uk publishes monthly street-level crime figures. These counts cover September 2026 and compare with September 2025; the publication date is not supplied here. They count recorded reports, not a population-adjusted rate, and the figures do not explain the reasons for changes.