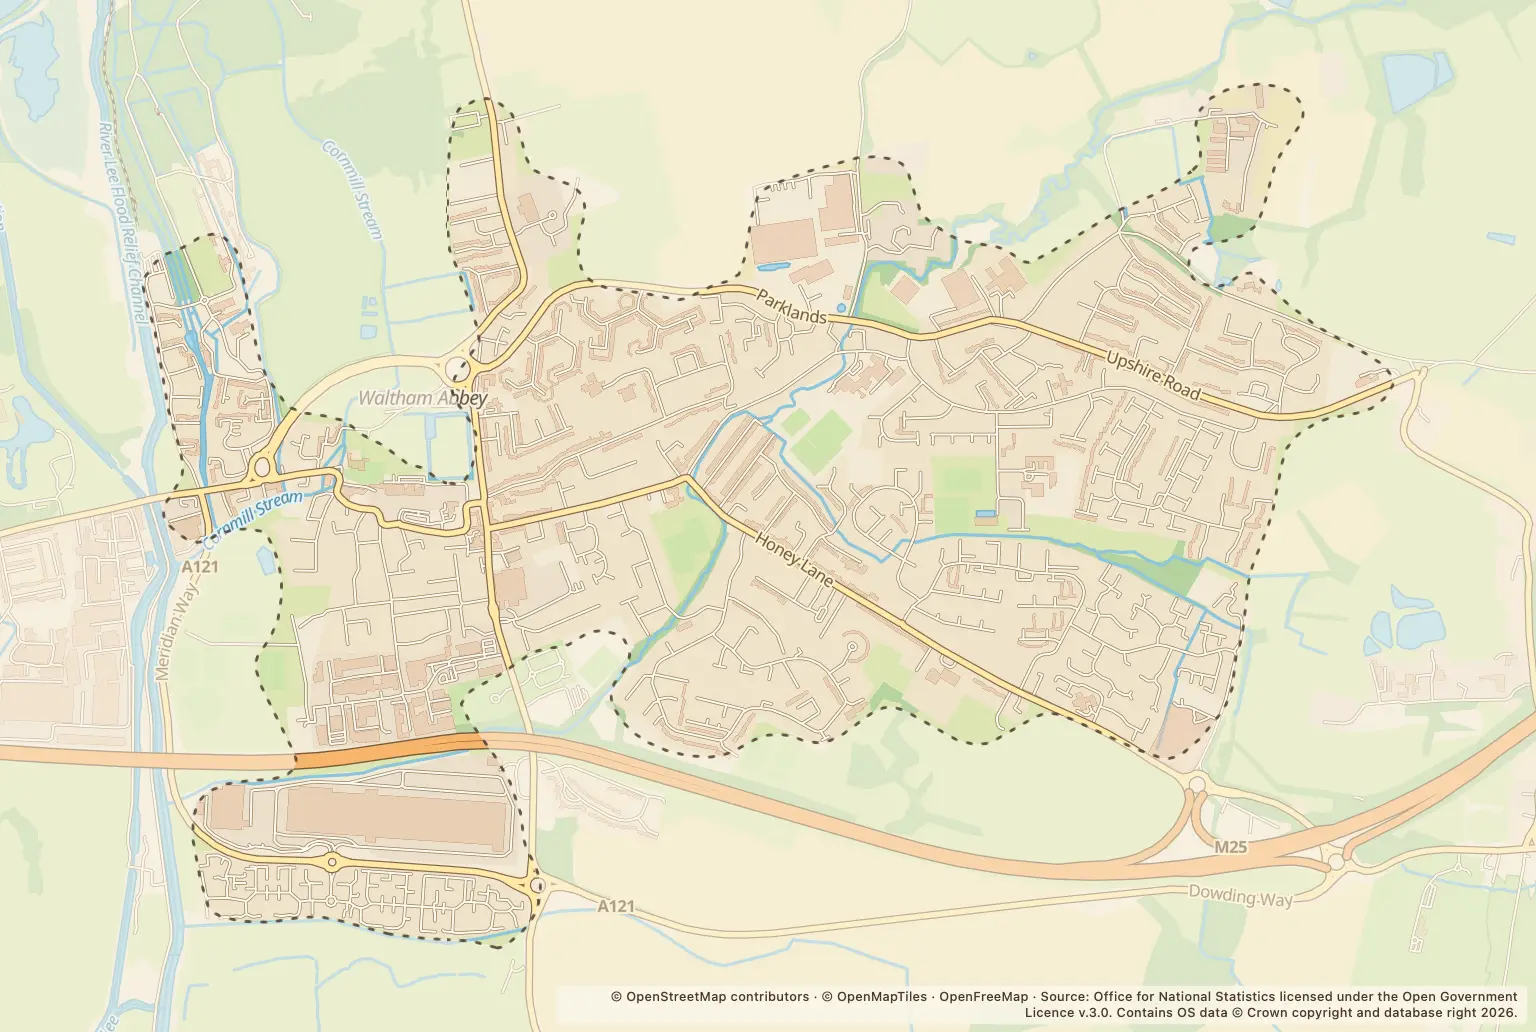
For anyone weighing up a move or checking their neighbourhood, the latest monthly count is almost unchanged year on year: 195 recorded crimes, compared with 194 in September 2025.
The small movement in the overall total masks bigger shifts between categories. Anti-social behaviour rose from 22 to 33, while burglary went from 1 to 5.
Which crime types were recorded in Waltham Abbey?
Violence and sexual offences remained the largest category, at 73. Anti-social behaviour was next, at 33; burglary recorded 5 cases, compared with 1 a year earlier.
| Crime type | September 2026 | September 2025 | Stated change |
|---|---|---|---|
| Violence and sexual offences | 73 | 76 | down 4% |
| Anti-social behaviour | 33 | 22 | up 50% |
| Vehicle crime | 20 | 24 | down 17% |
| Criminal damage and arson | 17 | 23 | down 26% |
| Public order | 16 | 14 | up 14% |
| Drugs | 8 | 14 | down 43% |
| Other theft | 8 | 9 | down 11% |
| Shoplifting | 6 | 5 | up 20% |
| Burglary | 5 | 1 | up 400% |
| Other crime | 3 | 2 | up 50% |
| Possession of weapons | 2 | 1 | up 100% |
| Robbery | 2 | 3 | down 33% |
| Theft from the person | 2 | 0 | No crimes recorded a year earlier |
Source: police.uk, Street-level crime figures for Waltham Abbey, September 2026, compared with September 2025.
The percentage rises for burglary and possession of weapons start from small counts: burglary increased from 1 to 5, and possession of weapons from 1 to 2. Those changes are worth noting, but the counts are small. The figures do not show the circumstances of individual offences.
How did Waltham Abbey crime totals change over recent months?
The monthly total was lower in each of the last three months shown than in the month before: 236 in June 2026, 232 in July, 222 in August and 195 in September. That gives a short run of monthly figures, not a measure of the risk to an individual household.
The September total was also close to the 194 recorded in September 2025. Looking at the overall count alone would miss the rise in anti-social behaviour and burglary, as well as falls in violence and vehicle crime.
Where were the most crimes mapped in Waltham Abbey?
Romeland and a location labelled Supermarket had the highest listed counts, with 11 each in September. These are mapped locations, not a measure of crime risk for every home on or near a road.
| Mapped location | Recorded crimes |
|---|---|
| Romeland | 11 |
| Supermarket | 11 |
| Skarnings Court | 8 |
| Grove Court | 6 |
| Darby Drive | 5 |
| Lucas Court | 5 |
| Old Shire Lane | 5 |
| Caldbeck | 4 |
| Downlands | 4 |
| Harveyfields | 4 |
| Oxleys Road | 4 |
| The Dale | 4 |
| Willinghall Close | 4 |
Source: police.uk, Street-level crime figures for Waltham Abbey, September 2026.
The location labels include places such as Supermarket, rather than only residential streets. The counts do not account for how many people live, work or visit each place, so they should not be used as a direct comparison of neighbourhood safety.
How can I check crime near a home in Waltham Abbey?
Use the police.uk crime map and neighbourhood policing team to check mapped offences around an area you are considering and find local policing information. For a fuller picture, compare more than one month and check the location labels as well as the category counts.
About the figures
police.uk publishes the Street-level crime figures. The latest month covered here is September 2026, with year-on-year comparisons for September 2025 and monthly totals from June to September 2026. The publication date is not stated in the figures.
These are recorded crime counts, not a crime rate per resident. The figures supplied do not include comparable totals for neighbouring towns, Epping Forest or Essex, or the population denominator needed to compare rates.