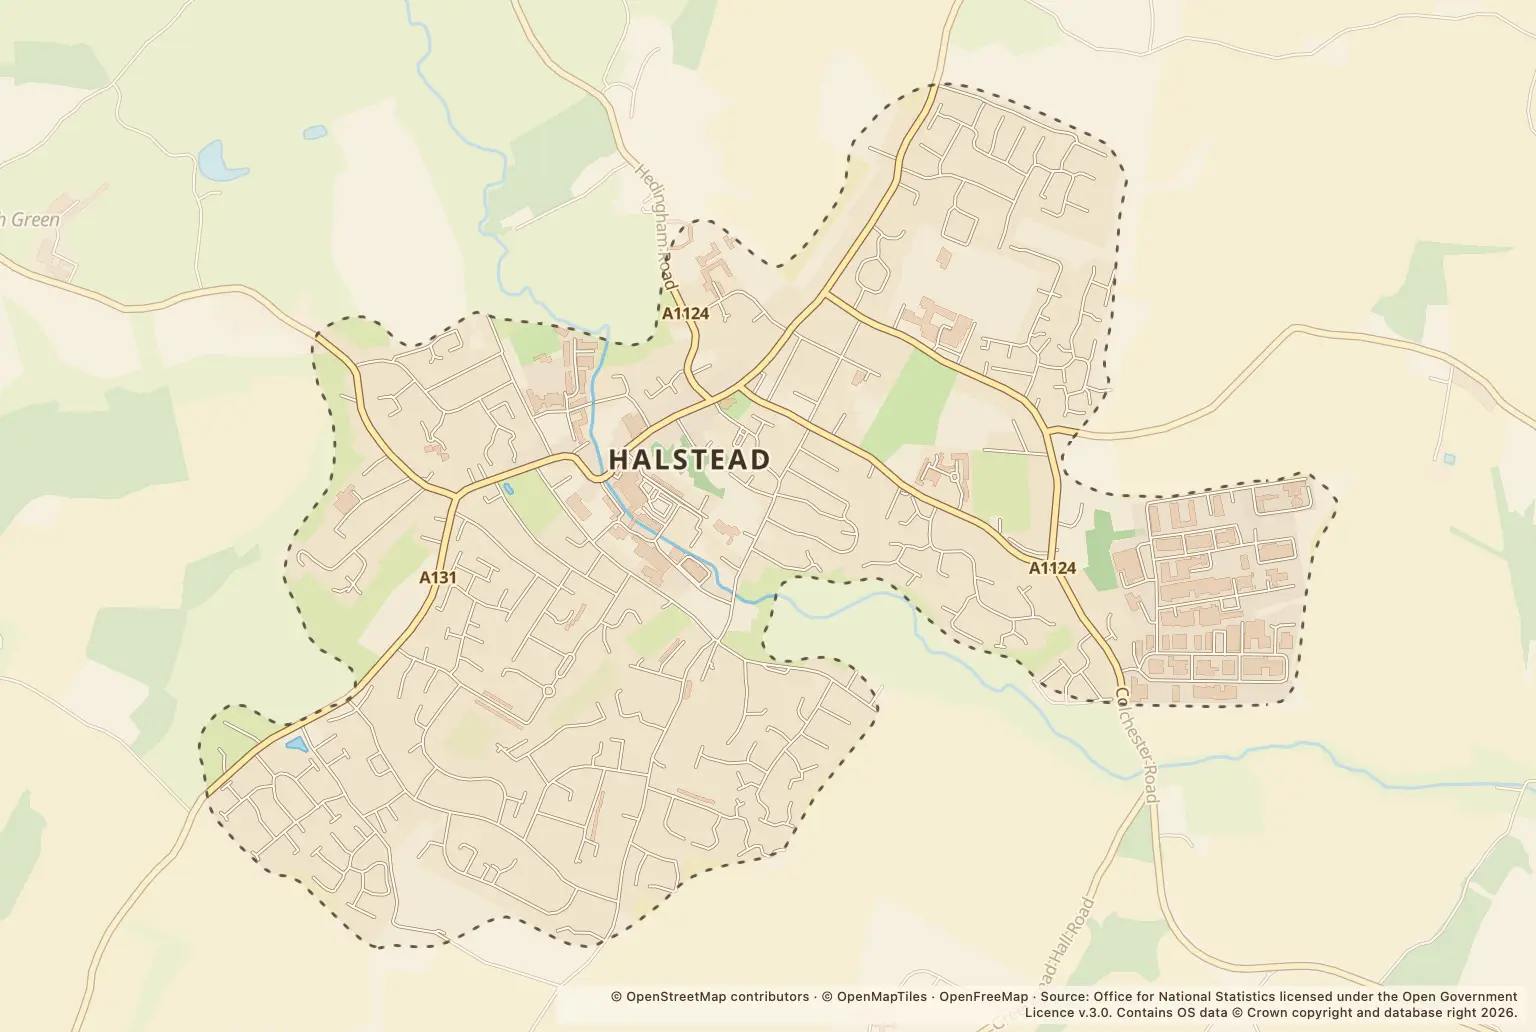
For anyone weighing up a move to Halstead, the latest monthly count is a sharp change: 110 crimes were recorded in September 2026, compared with 74 in September 2025.
That is a count for one month, not a crime rate or a measure of the risk at a particular home. The figures show what was recorded by category and location, but do not compare Halstead with nearby towns, Braintree district or Essex.
How did Halstead’s monthly crime figures change?
September’s 110 recorded crimes were above the 101 in August 2026 and the 75 in July 2026. Those three monthly totals show an increase across that period, but do not establish a longer-term trend.
The year-on-year rise was up 49%, from 74 crimes in September 2025. A single month can be affected by changes in particular categories, so it is worth looking at the breakdown as well as the total.
Which types of crime increased in Halstead?
Violence and sexual offences made up the largest category, with 39 records, compared with 32 a year earlier. Anti-social behaviour rose to 16 from 9; other theft rose to 8 from 2. The table compares the categories reported for September.
| Crime category | September 2026 | September 2025 | Change |
|---|---|---|---|
| Violence and sexual offences | 39 | 32 | up 22% |
| Anti-social behaviour | 16 | 9 | up 78% |
| Shoplifting | 10 | 8 | up 25% |
| Burglary | 4 | 1 | up 300% |
| Criminal damage and arson | 8 | 4 | up 100% |
| Drugs | 2 | 8 | down 75% |
| Other theft | 8 | 2 | up 300% |
| Possession of weapons | 3 | 1 | up 200% |
| Public order | 8 | 3 | up 167% |
| Robbery | 1 | 0 | — |
| Vehicle crime | 8 | 3 | up 167% |
| Other crime | 3 | 3 | unchanged |
Source: police.uk Street-level crime figures for Halstead, September 2026, compared with September 2025.
Some of the largest percentage rises are from small starting numbers: burglary went from 1 to 4, and other theft from 2 to 8. The counts give the scale behind those percentages. Drugs moved in the opposite direction, falling from 8 to 2.
Which Halstead locations had the most recorded crimes?
The street-level figures assign the largest number of records to a location labelled “Supermarket”. Other entries include named roads and broader labels such as “Petrol Station”; they are not a count of crimes at any particular home.
| Location label | Recorded crimes |
|---|---|
| Supermarket | 13 |
| Petrol Station | 7 |
| A131 | 5 |
| Holmes Road | 5 |
| Colne Road | 4 |
| Upper Chapel Street | 4 |
| Deacon Lane | 3 |
| Pretoria Road | 3 |
| The Centre | 3 |
Source: police.uk Street-level crime figures for Halstead, September 2026.
Use these locations as a guide to where records were assigned, not as a ranking of residential streets or a measure of safety for a property. The figures do not show how many people use each location or live nearby.
What do Halstead’s crime figures tell home movers?
The monthly counts can help you decide what to check, but they cannot show a crime rate: there is no population denominator here. Nor do these figures provide a like-for-like comparison with neighbouring towns, Braintree district or Essex.
Recorded crime is not the same as every offence that may have taken place. The figures cover one month, and a rise in the total does not mean every part of Halstead experienced the same change.
How can I check crime around a Halstead home?
Use the police.uk crime map and neighbourhood policing team to check the area around a home you are considering and find local policing information. Compare the map with a visit to the area, and check any crime figures over more than one month rather than relying on September alone.
About the figures
Police.uk’s Street-level crime figures cover Halstead in September 2026, with September 2025 used for the year-on-year comparison. The supplied figures do not state a publication date. Monthly counts are not population-based crime rates, and location labels do not identify individual homes.