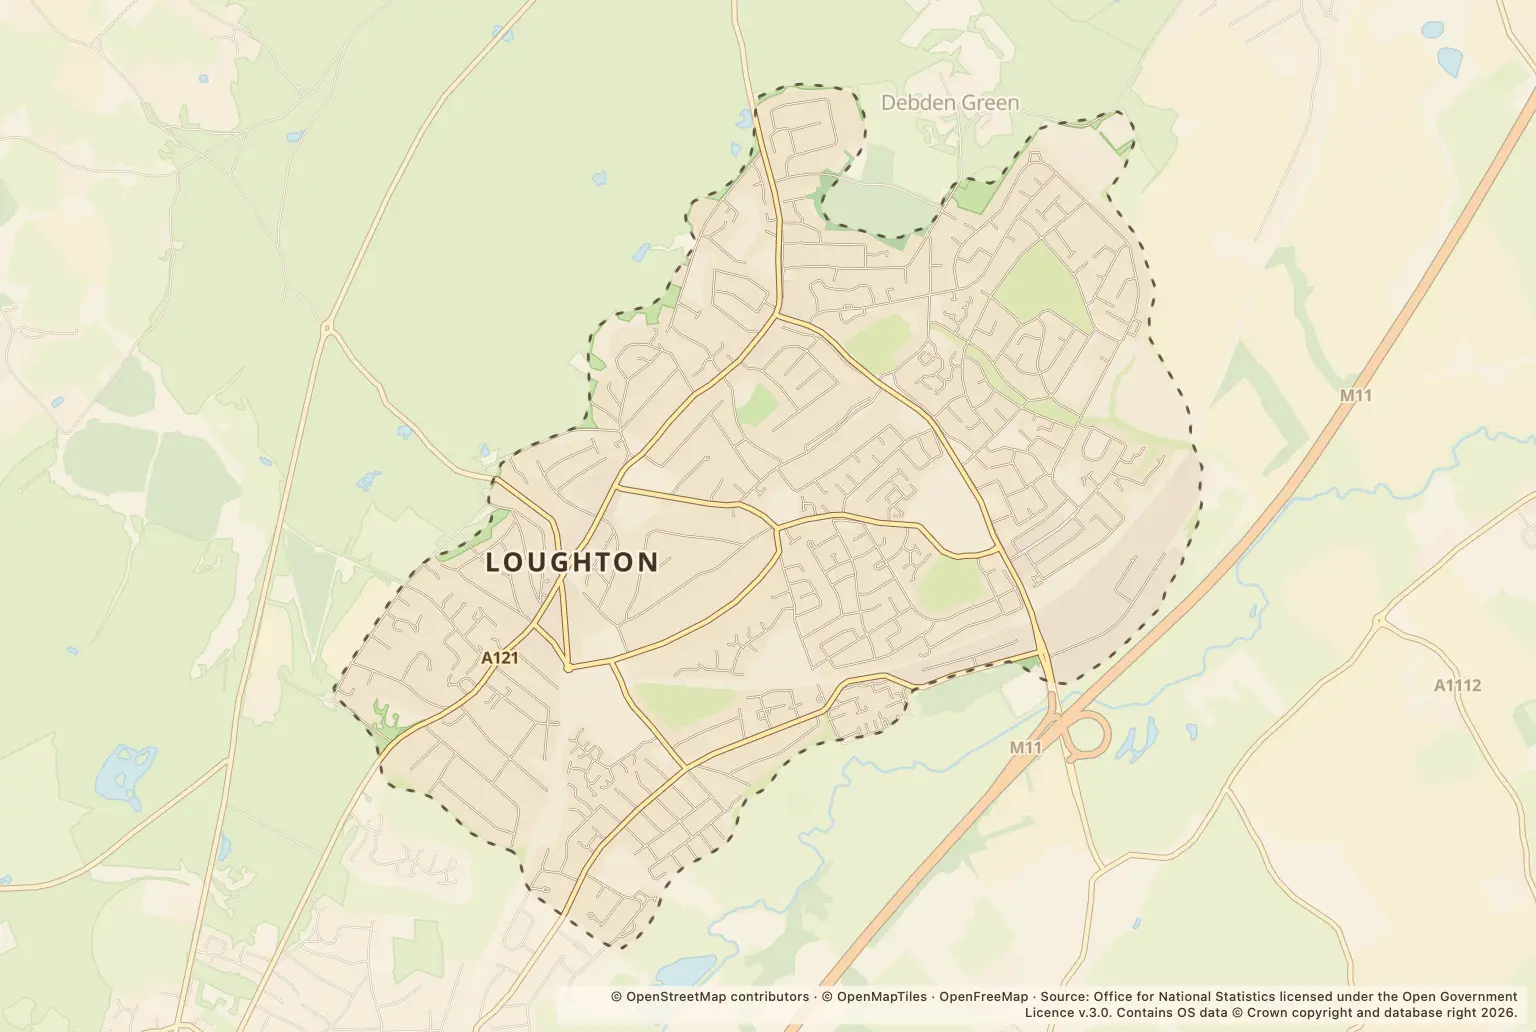
Police recorded 226 crimes and anti-social behaviour reports in Loughton in September 2026, up 12% on the 202 recorded in September 2025.
The figures offer a snapshot for people weighing up a move or checking their neighbourhood. They do not show a crime rate for residents or whether Loughton is safer than nearby towns.
Which crime types rose in Loughton?
Anti-social behaviour had the sharpest rise among the larger categories, from 11 reports to 27. Shoplifting also rose, from 17 to 27, while violence and sexual offences increased from 72 to 89. Robbery rose from 1 to 5, a large percentage change from a small starting number.
| Category | September 2026 | September 2025 | Change |
|---|---|---|---|
| Violence and sexual offences | 89 | 72 | up 24% |
| Anti-social behaviour | 27 | 11 | up 145% |
| Shoplifting | 27 | 17 | up 59% |
| Vehicle crime | 17 | 17 | unchanged |
| Public order | 14 | 26 | down 46% |
| Other theft | 13 | 19 | down 32% |
| Criminal damage and arson | 12 | 15 | down 20% |
| Burglary | 9 | 10 | down 10% |
| Drugs | 6 | 6 | unchanged |
| Robbery | 5 | 1 | up 400% |
| Other crime | 4 | 3 | up 33% |
| Theft from the person | 2 | 4 | down 50% |
| Possession of weapons | 1 | 1 | unchanged |
Source: police.uk Street-level crime figures for September 2026, compared with September 2025.
Where were reports recorded in Loughton?
The largest location labels in the September figures were Shopping Area and Supermarket, with 22 reports each. Parking Area had 14 and Lushes Road had 9.
These are mapped location labels, not a ranking of residential streets. They do not mean that reports happened at a particular home, and counts for one month are too small to establish a lasting pattern.
How should movers compare Loughton crime figures?
September’s total was below the 245 recorded in August 2026 and the 250 in July 2026. It was also above the 238 recorded in September 2024. Month-to-month counts can move around, so these comparisons do not establish a long-term trend.
The figures cover one month and are counts, not a crime rate adjusted for the number of people living in each area. They also do not provide like-for-like totals for Epping Forest or Essex, so they cannot show whether Loughton has a higher or lower rate than neighbouring places.
How can I check crime near a Loughton home?
Use the police.uk crime map and neighbourhood policing team service to check reports around an area you are considering and find neighbourhood policing information. Compare the map with a visit at different times of day; the monthly figures alone cannot tell you what a particular street feels like to live on.
About the figures
police.uk published the Street-level crime figures for September 2026. They cover recorded reports in Loughton for that month, with comparisons against September 2025. The figures are counts rather than a population-based crime rate, and a single month cannot show a lasting trend.