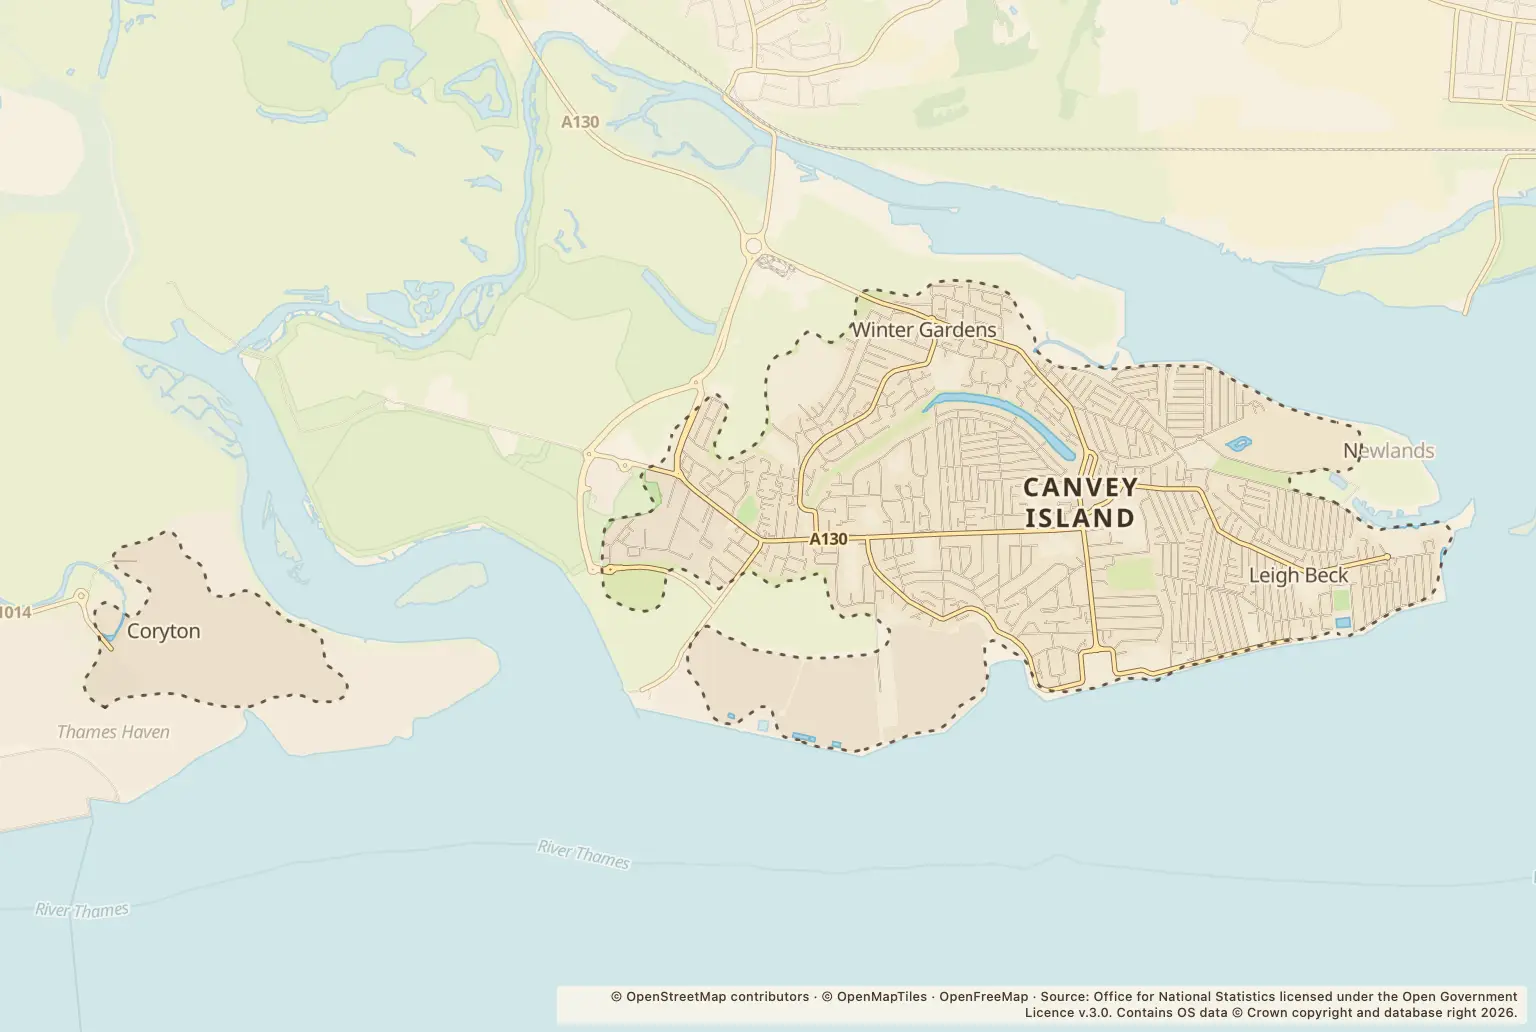
Police recorded 2878 crimes on Canvey Island during 2025. December had the highest monthly total, with 265.
For someone choosing where to live, that is a useful overview, but not a measure of the chance of crime at a particular home. The figures do not include a population-based rate or a matching comparison with Castle Point or Essex.
Which offences made up most of Canvey Island's crime figures?
Violence and sexual offences accounted for 1240 recorded crimes, followed by anti-social behaviour (439) and criminal damage and arson (308).
The remaining categories were public order (181), other theft (153), shoplifting (149), vehicle crime (105), drugs (87), other crime (71), burglary (67), possession of weapons (31), bicycle theft (17), robbery (17) and theft from the person (13).
How did recorded crime vary by month on Canvey Island?
December 2025 had 265 recorded crimes, compared with 247 in November 2025 and 202 in December 2024. The monthly figures below show how the total varied across 2025.
Can you compare Canvey Island's crime figures with Castle Point or Essex?
Not from these annual figures alone. They give a Canvey Island count, but no comparable Castle Point or Essex total and no crime rate per resident. A larger area may record more crimes simply because it has more people, so counts alone cannot show which place has a higher rate.
What should home movers check next?
Use the police.uk crime map and neighbourhood policing team to look at recorded crime in the area around a home and find local policing contacts. Check the location and period carefully: an area-wide annual count does not describe the pattern near an individual property.
About the figures
Police.uk street-level crime figures cover January to December 2025. They count crimes recorded by police, not every crime that may have occurred, and do not provide a population-based crime rate here. The publication date is not stated.