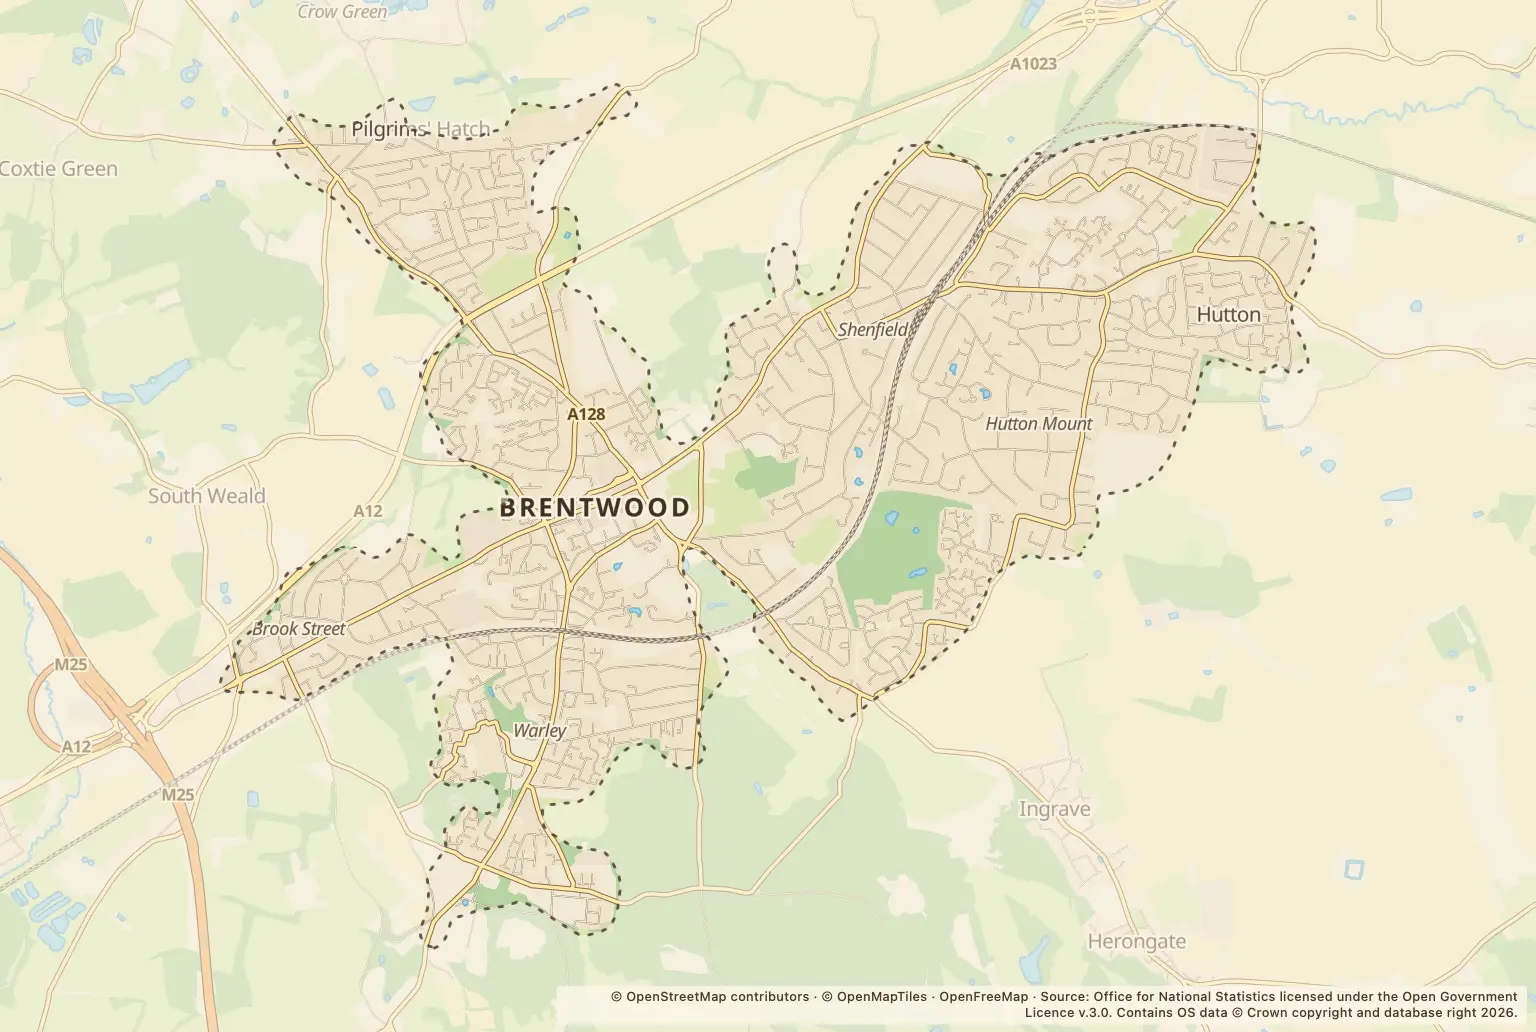
For anyone weighing up a move to Brentwood, violence and sexual offences were the largest recorded crime category in 2025, with 1455 offences. There were 4653 recorded crimes overall.
Which crime categories were most common in Brentwood in 2025?
The leading category was well ahead of shoplifting, the next largest. The figures also include vehicle crime, anti-social behaviour and burglary.
| Crime category | Recorded crimes |
|---|---|
| Violence and sexual offences | 1455 |
| Shoplifting | 728 |
| Vehicle crime | 489 |
| Anti-social behaviour | 387 |
| Public order | 314 |
| Other theft | 310 |
| Drugs | 308 |
| Criminal damage and arson | 277 |
| Burglary | 172 |
| Other crime | 77 |
| Possession of weapons | 48 |
| Robbery | 36 |
| Theft from the person | 36 |
| Bicycle theft | 16 |
Source: police.uk Street-level crime figures for January to December 2025.
Did recorded crime vary by month in Brentwood?
August was the busiest month, with 460 recorded crimes. For comparison, January had 325. Monthly totals show when reports were recorded, but do not explain why they changed.
What can Brentwood's crime figures tell home-movers?
The figures give a count of crimes recorded in Brentwood, not a crime rate or a measure of an individual resident’s risk. They do not account for the number of people living in or visiting the area, and the broad categories do not describe the circumstances or severity of each offence.
This release gives Brentwood figures only, so it does not provide a like-for-like comparison with neighbouring towns, the council area or Essex. When comparing areas, check that the boundaries and periods match.
How can I check crime around a Brentwood home?
Use the police.uk crime map and neighbourhood policing team to check recorded crime around an area you are considering and find local policing information. Street-level counts can help you ask more specific questions, but they cannot predict what will happen at a particular home.
About the figures
police.uk published these Street-level crime figures for 2025. The publication date is not stated here. They count recorded crimes and do not provide a population-based rate or a comparison with other areas.