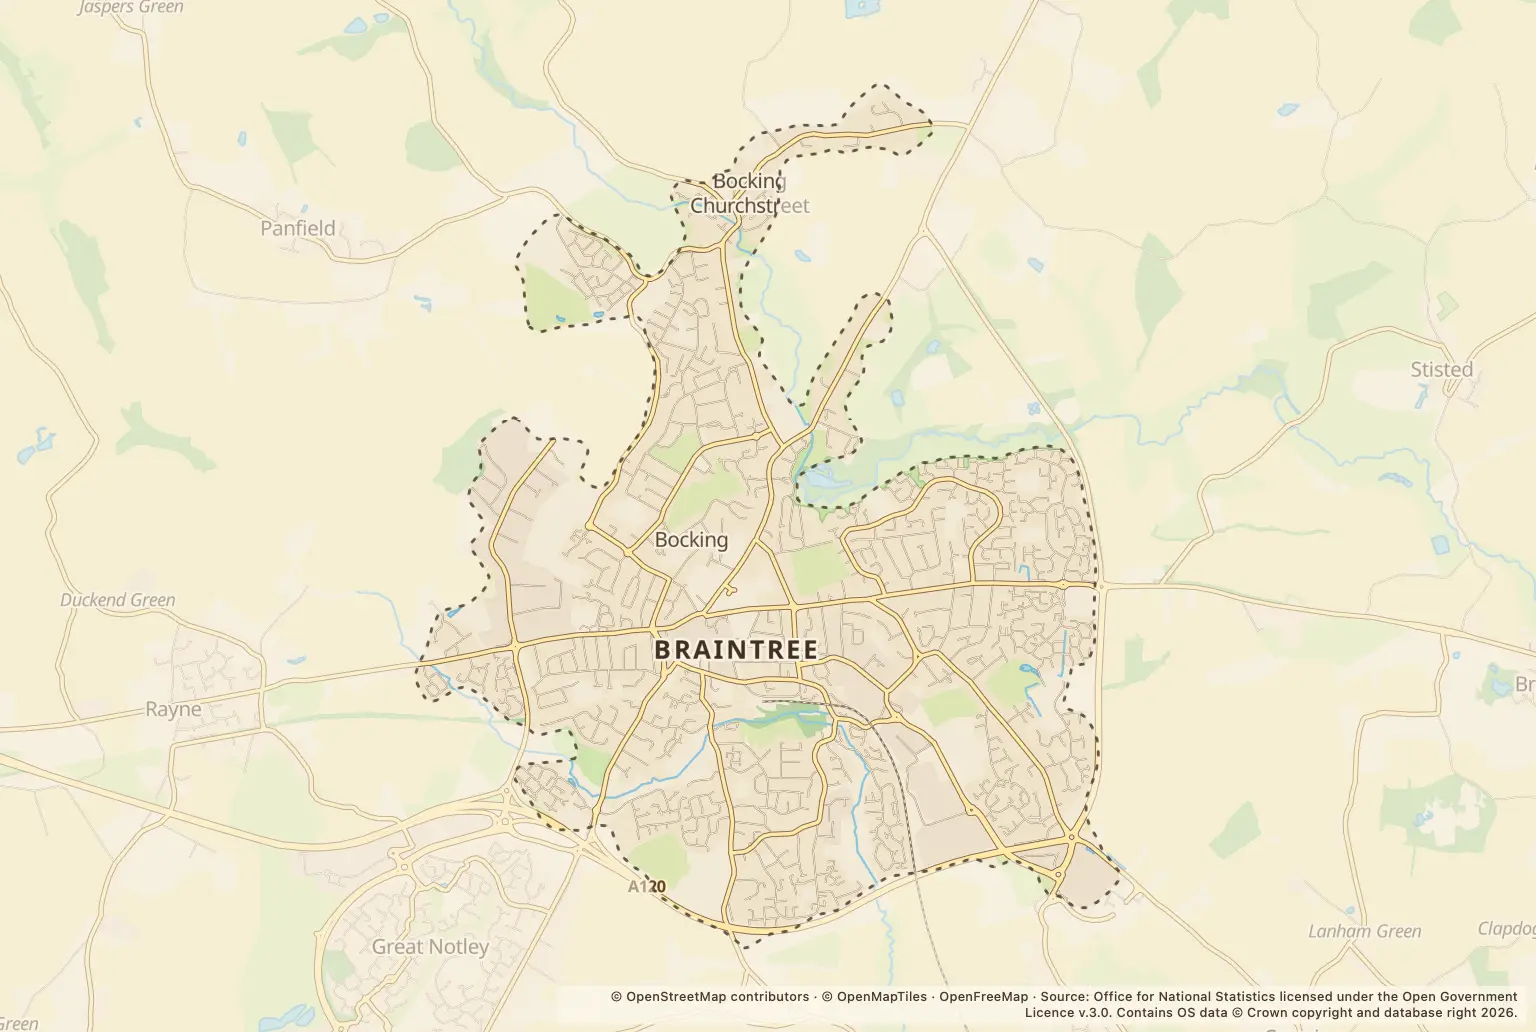
Police.uk recorded 3648 crimes in Braintree in 2025. That is a count of offences reported to police, not a measure of the chance of crime at a particular home.
For someone comparing neighbourhoods, the figures are a useful starting point, but they do not provide a crime rate for Braintree or show how many people were affected.
What kinds of crime were recorded in Braintree?
| Crime type | Recorded offences |
|---|---|
| Violence and sexual offences | 1683 |
| Anti-social behaviour | 357 |
| Shoplifting | 278 |
| Public order | 275 |
| Criminal damage and arson | 239 |
| Other theft | 235 |
| Drugs | 177 |
| Vehicle crime | 131 |
| Other crime | 106 |
| Burglary | 75 |
| Possession of weapons | 35 |
| Robbery | 25 |
| Theft from the person | 23 |
| Bicycle theft | 9 |
Source: police.uk, Street-level crime, for 2025.
Violence and sexual offences were the largest category by a clear margin in the annual count. These categories describe offences recorded by police; they do not say whether an offence happened to a resident or a visitor.
When were crime reports highest in Braintree?
April 2025 was the busiest month, with 352 recorded crimes. December had 273, the lowest monthly total among the 2025 figures.
A higher count in one month does not by itself show a lasting rise or fall. Monthly totals can help put the annual figure in context, but they do not explain why reports varied.
How does Braintree compare with the wider district?
These figures cover Braintree town, while Essex Police, Fire and Crime Commissioner figures cover Braintree district and a different period. The commissioner’s office reported that, in the 12 months to the end of June 2025, all crime across the district was down 5.1%, anti-social behaviour was down 3.7% and burglary was down 14.2%.
That district-wide update is not a direct comparison with the town’s full-year count. The figures here do not give a matching crime rate for Braintree town, the council area or Essex.
How can I check crime near a home in Braintree?
Use the police.uk crime map and neighbourhood policing team to check the area around a property and find local policing information. Look at the map alongside a visit to the neighbourhood; an annual town total cannot tell you what is happening on an individual street.
Crime counts alone do not show the likelihood of becoming a victim. If safety is part of a move, check the map for the specific area and consider other practical factors such as transport, schools and planned building.
About the figures
Police.uk’s Street-level crime figures cover offences recorded in Braintree during 2025. The publication date for this annual summary is not stated. These are counts, not a population-adjusted crime rate, and the annual figures do not provide a like-for-like comparison with the wider district or Essex.