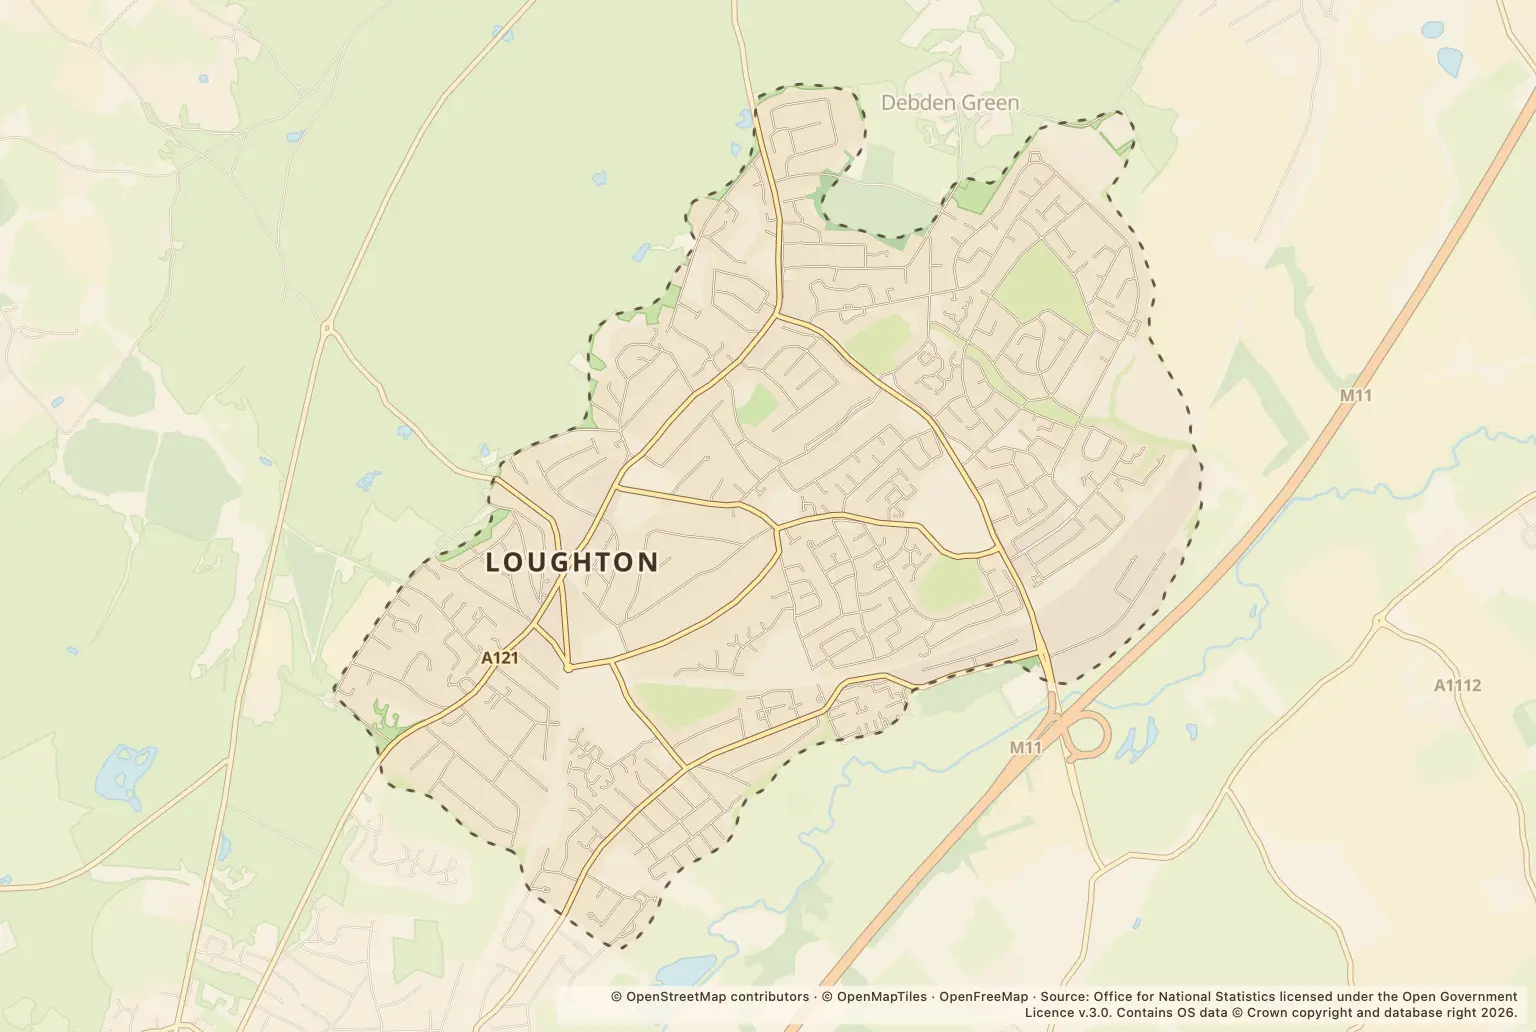
Police recorded 2,927 crimes in Loughton in 2025. For anyone choosing where to live, that is the town-wide count for the year, not a measure of the risk to an individual household.
Violence and sexual offences accounted for 979 recorded crimes. Shoplifting was the next largest listed category, with 496.
Which crimes were most common in Loughton in 2025?
The figures cover a range of offences, from shoplifting and vehicle crime to burglary and anti-social behaviour. The categories below show what made up the recorded total.
| Crime category | Recorded crimes |
|---|---|
| Violence and sexual offences | 979 |
| Shoplifting | 496 |
| Vehicle crime | 260 |
| Anti-social behaviour | 233 |
| Public order | 208 |
| Criminal damage and arson | 188 |
| Other theft | 153 |
| Drugs | 130 |
| Burglary | 128 |
| Other crime | 49 |
| Theft from the person | 36 |
| Robbery | 35 |
| Possession of weapons | 24 |
| Bicycle theft | 8 |
Source: police.uk Street-level crime figures for Loughton, January to December 2025.
These are counts, not rates. They do not show how many crimes there were per resident, or how likely someone living in a particular part of Loughton is to experience crime.
When were the most crimes recorded in Loughton?
June had the highest monthly count, with 299 recorded crimes. The figures for each month show how the total was distributed across the year.
| Month | Recorded crimes |
|---|---|
| January 2025 | 217 |
| February 2025 | 225 |
| March 2025 | 253 |
| April 2025 | 246 |
| May 2025 | 286 |
| June 2025 | 299 |
| July 2025 | 284 |
| August 2025 | 223 |
| September 2025 | 202 |
| October 2025 | 247 |
| November 2025 | 203 |
| December 2025 | 242 |
Source: police.uk Street-level crime figures for Loughton, January to December 2025.
The June count was also higher than the 283 recorded in June 2024. That is a comparison of one month only, not evidence of a change across the full year.
How can I check crime near a home in Loughton?
Before deciding on a property, use the police.uk crime map and neighbourhood policing team to check reported crime around the area and find local policing contacts. Look at the locations and types of offences as well as the totals; the annual town-wide figures cannot tell you what is happening on a particular street.
Can these figures be compared with Epping Forest or Essex?
The figures here do not give comparable 2025 totals for Epping Forest, Essex or neighbouring towns, and they include no population figures for calculating rates. A direct comparison would need the same period, crime categories and method of counting for each place.
About the figures
The figures are from police.uk Street-level crime statistics and cover recorded crimes in Loughton during 2025. The publication date is not stated. Recorded crime figures count offences reported to and recorded by police; they do not represent every crime that may have taken place.