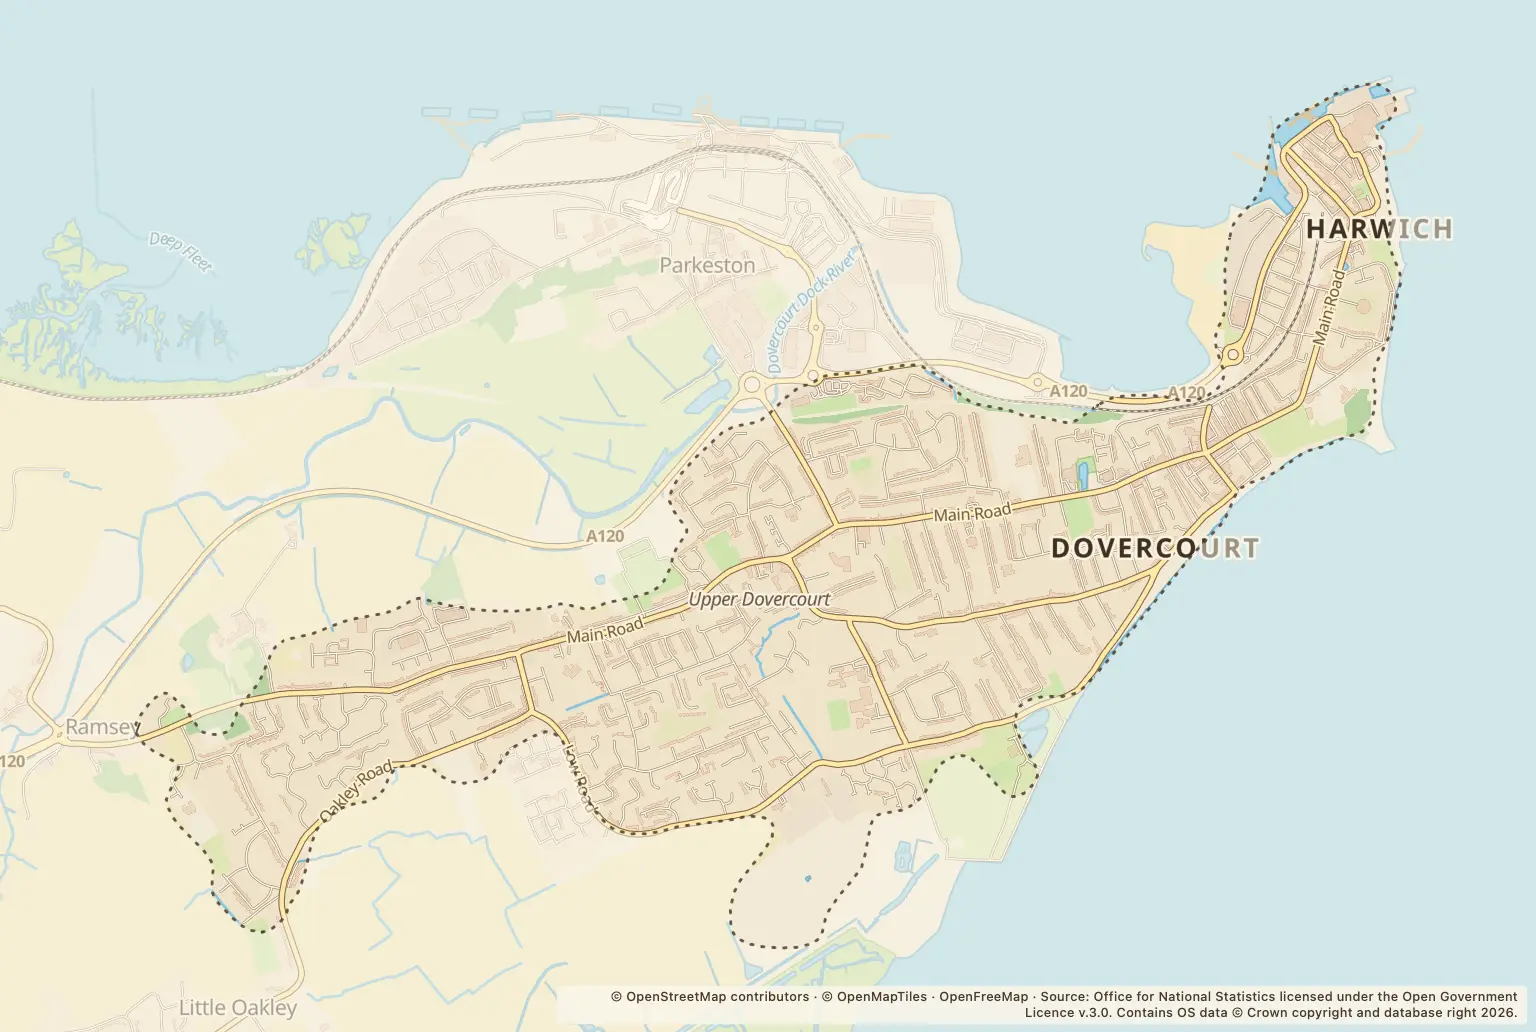
Harwich recorded 2079 crimes in 2025. The count gives residents and people considering a move a picture of crimes reported to police, but it does not show an individual’s likelihood of becoming a victim or provide a crime rate for comparison with Tendring or Essex.
What types of crime were recorded in Harwich in 2025?
| Crime type | Recorded crimes |
|---|---|
| Violence and sexual offences | 957 |
| Criminal damage and arson | 228 |
| Anti-social behaviour | 200 |
| Public order | 173 |
| Shoplifting | 166 |
| Other theft | 120 |
| Vehicle crime | 59 |
| Burglary | 52 |
| Other crime | 43 |
| Drugs | 28 |
| Possession of weapons | 21 |
| Bicycle theft | 14 |
| Robbery | 12 |
| Theft from the person | 6 |
Source: police.uk, Street-level crime, January to December 2025.
Violence and sexual offences had the highest count. Theft from the person and robbery had the lowest counts in this breakdown. These are categories of recorded crime, not a measure of how safe a particular street or home is.
Which month had the most recorded crime in Harwich?
| Month | Recorded crimes |
|---|---|
| January 2025 | 165 |
| February 2025 | 169 |
| March 2025 | 165 |
| April 2025 | 153 |
| May 2025 | 166 |
| June 2025 | 194 |
| July 2025 | 227 |
| August 2025 | 178 |
| September 2025 | 173 |
| October 2025 | 165 |
| November 2025 | 150 |
| December 2025 | 174 |
Source: police.uk, Street-level crime, January to December 2025.
July had the highest monthly total and November the lowest. The monthly figures show that reported crime varied over the year, but do not explain what caused those changes.
How can I check crime around a Harwich home?
Search the area on police.uk crime map and neighbourhood policing team and check the neighbourhood policing information. Street-level counts can help when comparing locations, but they do not describe each property or account for how many people use an area.
About the figures
police.uk publishes these Street-level crime figures for January to December 2025. The published summary does not state a release date or say whether the figures are provisional or revised. They count crimes recorded by police; crimes not reported to or recorded by police are not included. The Harwich total is a count, not a population-adjusted crime rate.