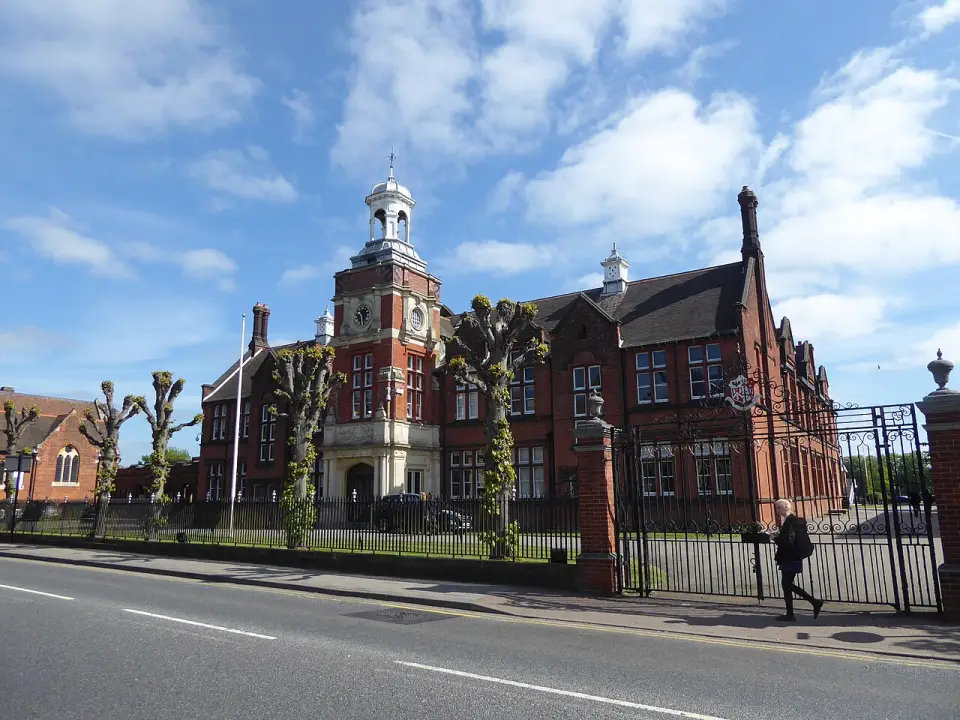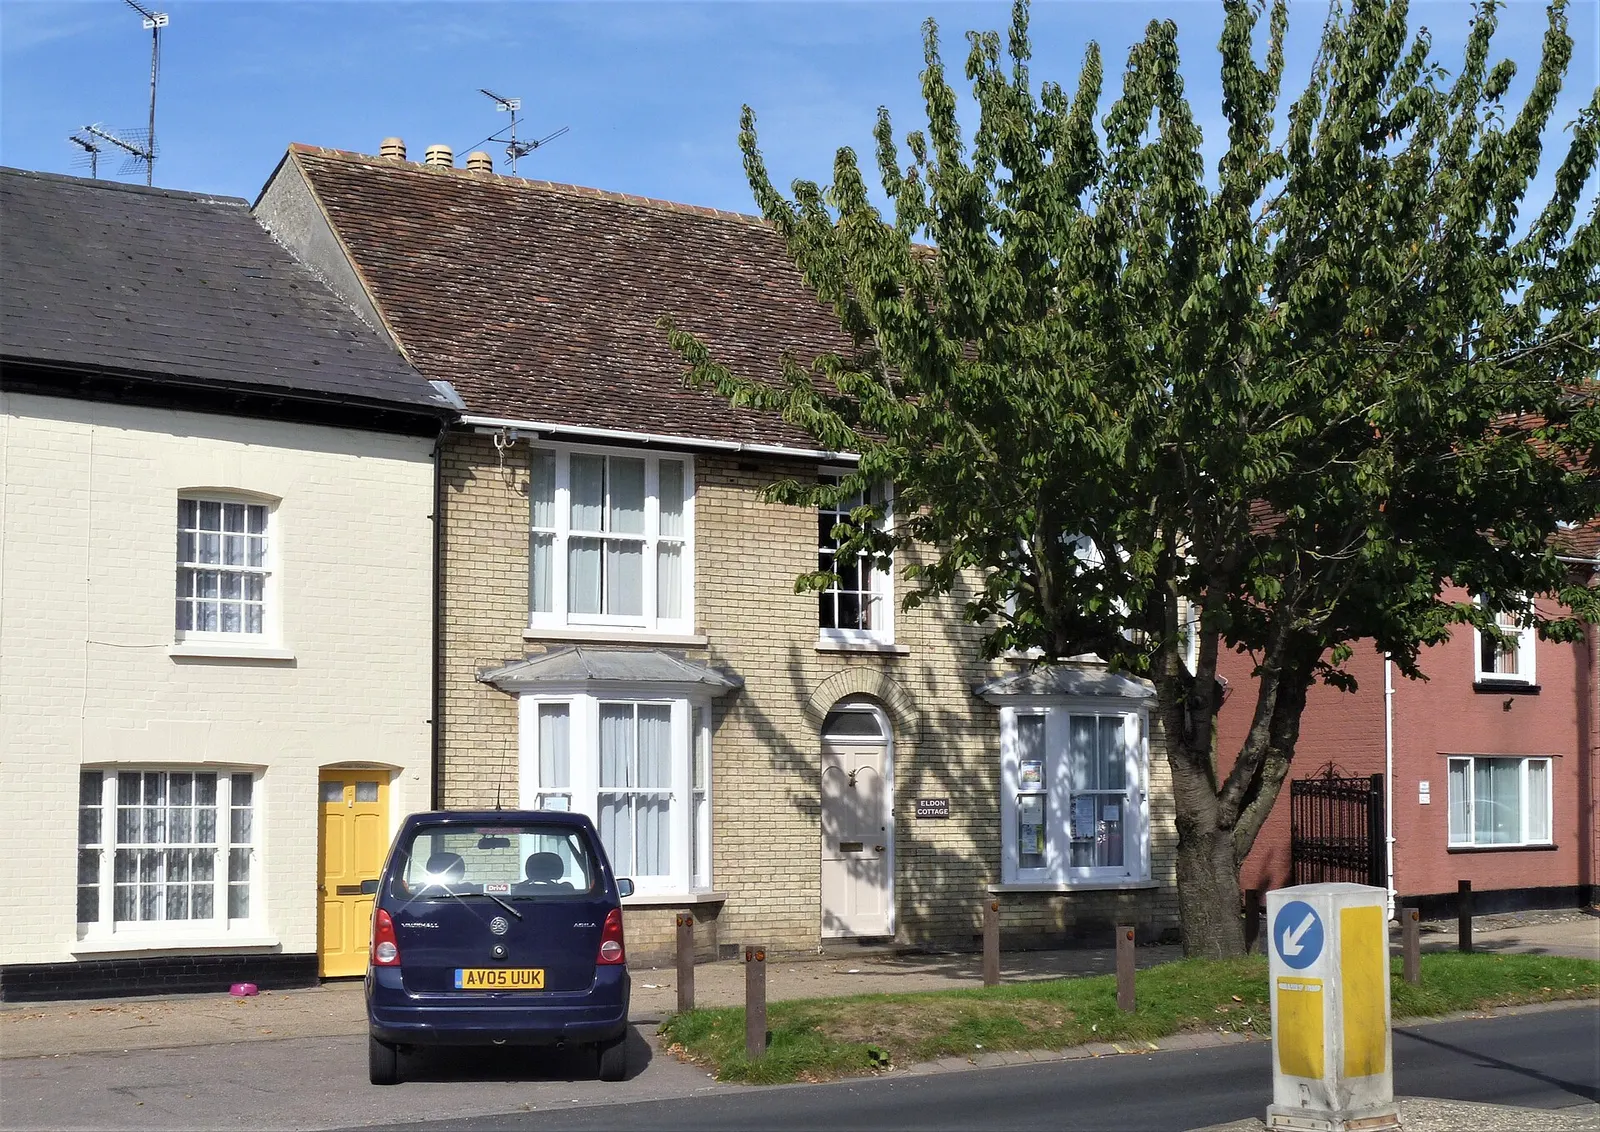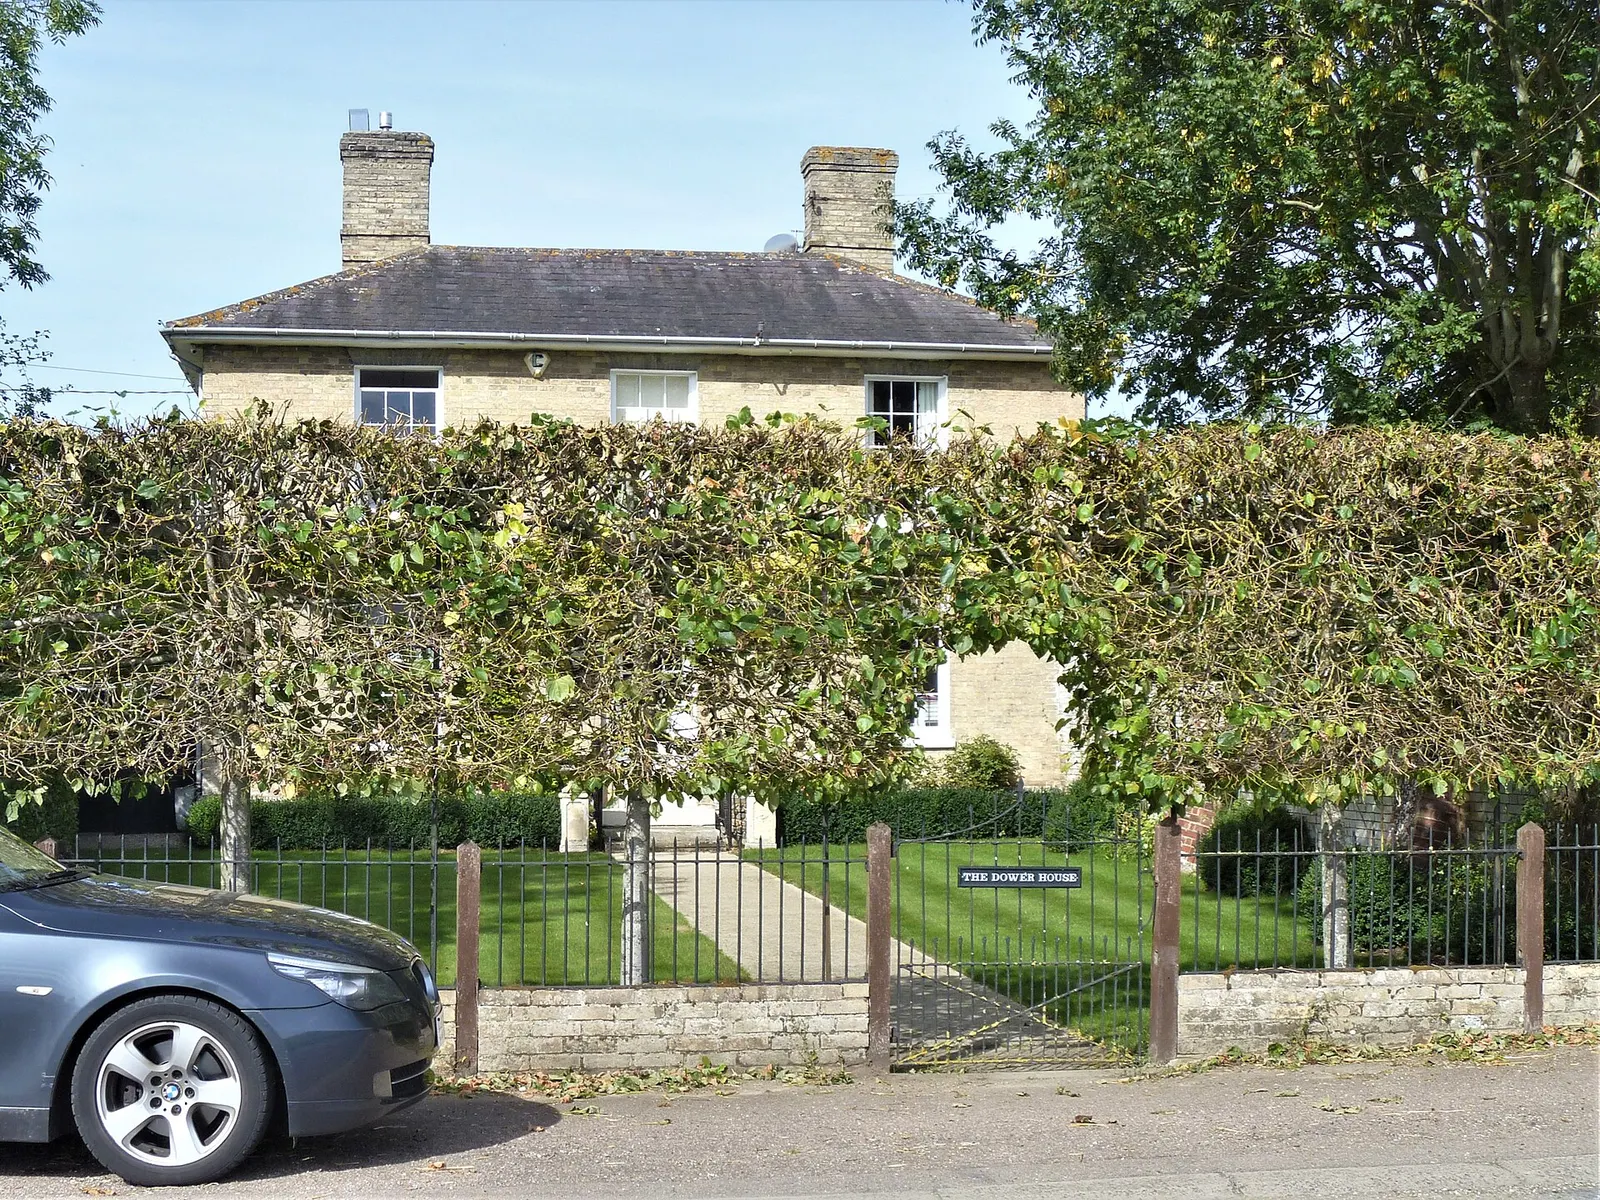
Where you look in Essex makes a substantial difference to the average home price: Tendring was the least expensive of the county’s 14 council areas listed, while Epping Forest was the most expensive.
The Essex average was £360,791. These figures can help narrow a search, but they are not asking prices or a guide to what every home in an area will cost.
How do house prices compare across Essex council areas?
| Area | Average home price | First-time buyer average | Annual change |
|---|---|---|---|
| Basildon | £367,920 | £307,721 | 0.8% |
| Braintree | £324,264 | £261,027 | 0.5% |
| Brentwood | £520,447 | £373,471 | 0.2% |
| Castle Point | £368,191 | £316,628 | -0.7% |
| Chelmsford | £378,412 | £298,428 | -0.8% |
| Colchester | £297,638 | £249,711 | 0.9% |
| Epping Forest | £536,719 | £415,027 | 2.1% |
| Harlow | £317,113 | £286,294 | 3.9% |
| Maldon | £406,165 | £317,488 | 5% |
| Rochford | £408,883 | £333,615 | 1.3% |
| Southend-on-Sea | £327,570 | £270,046 | 1.8% |
| Tendring | £258,932 | £220,732 | -2.2% |
| Thurrock | £322,338 | £296,723 | -0.7% |
| Uttlesford | £465,802 | £333,140 | -0.5% |
| Essex | £360,791 | £290,743 | 0.5% |
Source: HM Land Registry’s UK House Price Index, September 2026.
Tendring and Colchester were the two lowest-priced areas in the comparison. Harlow, Thurrock and Braintree were also below the Essex average. Epping Forest, Brentwood, Uttlesford, Rochford and Maldon were above it.
The first-time buyer average offers another comparison, but it is still an area-wide average rather than a price limit. In Tendring it was £220,732; in Colchester it was £249,711, and in Epping Forest it was £415,027.
How do prices vary by type of home?
| Home type | Tendring | Epping Forest | Essex |
|---|---|---|---|
| Detached | £366,896 | £1,022,897 | £581,090 |
| Semi-detached | £253,372 | £589,765 | £379,269 |
| Terraced | £201,441 | £468,221 | £310,741 |
| Flat | £130,581 | £296,026 | £188,898 |
Source: HM Land Registry’s UK House Price Index, September 2026.
The difference between areas is visible across each home type. A detached home averaged £366,896 in Tendring and £1,022,897 in Epping Forest; a flat averaged £130,581 and £296,026 respectively. These are averages for each category, not prices for a particular property.
Are house prices rising or falling in Essex?
Over the year to September 2026, the average price fell by 2.2% in Tendring and rose by 2.1% in Epping Forest. Across Essex, it rose by 0.5%. Harlow recorded a 3.9% annual rise, while Maldon rose by 5%.
The latest monthly figures show a different, shorter view: Tendring rose by 0.2% and Epping Forest by 2% between August and September 2026. Monthly movement does not replace the year-on-year comparison, and local estimates can shift more because they are based on fewer properties.
How can I check sold prices before choosing an area?
Use the HM Land Registry house price search to look up prices paid for homes in an area, or the HM Land Registry price paid data. Sold prices can help you compare individual transactions with an area average; they do not show current asking prices.
Before deciding where to buy or rent, compare the home type and size you need, then check local schools, crime rates and planned building as well as the price.
About the figures
HM Land Registry publishes the UK House Price Index. These figures cover September 2026; the Office for National Statistics’ local housing pages were last updated on 18 November 2026. The ONS says local house price estimates are provisional, subject to revision and based on fewer properties than national estimates, so short-term changes can be more variable.