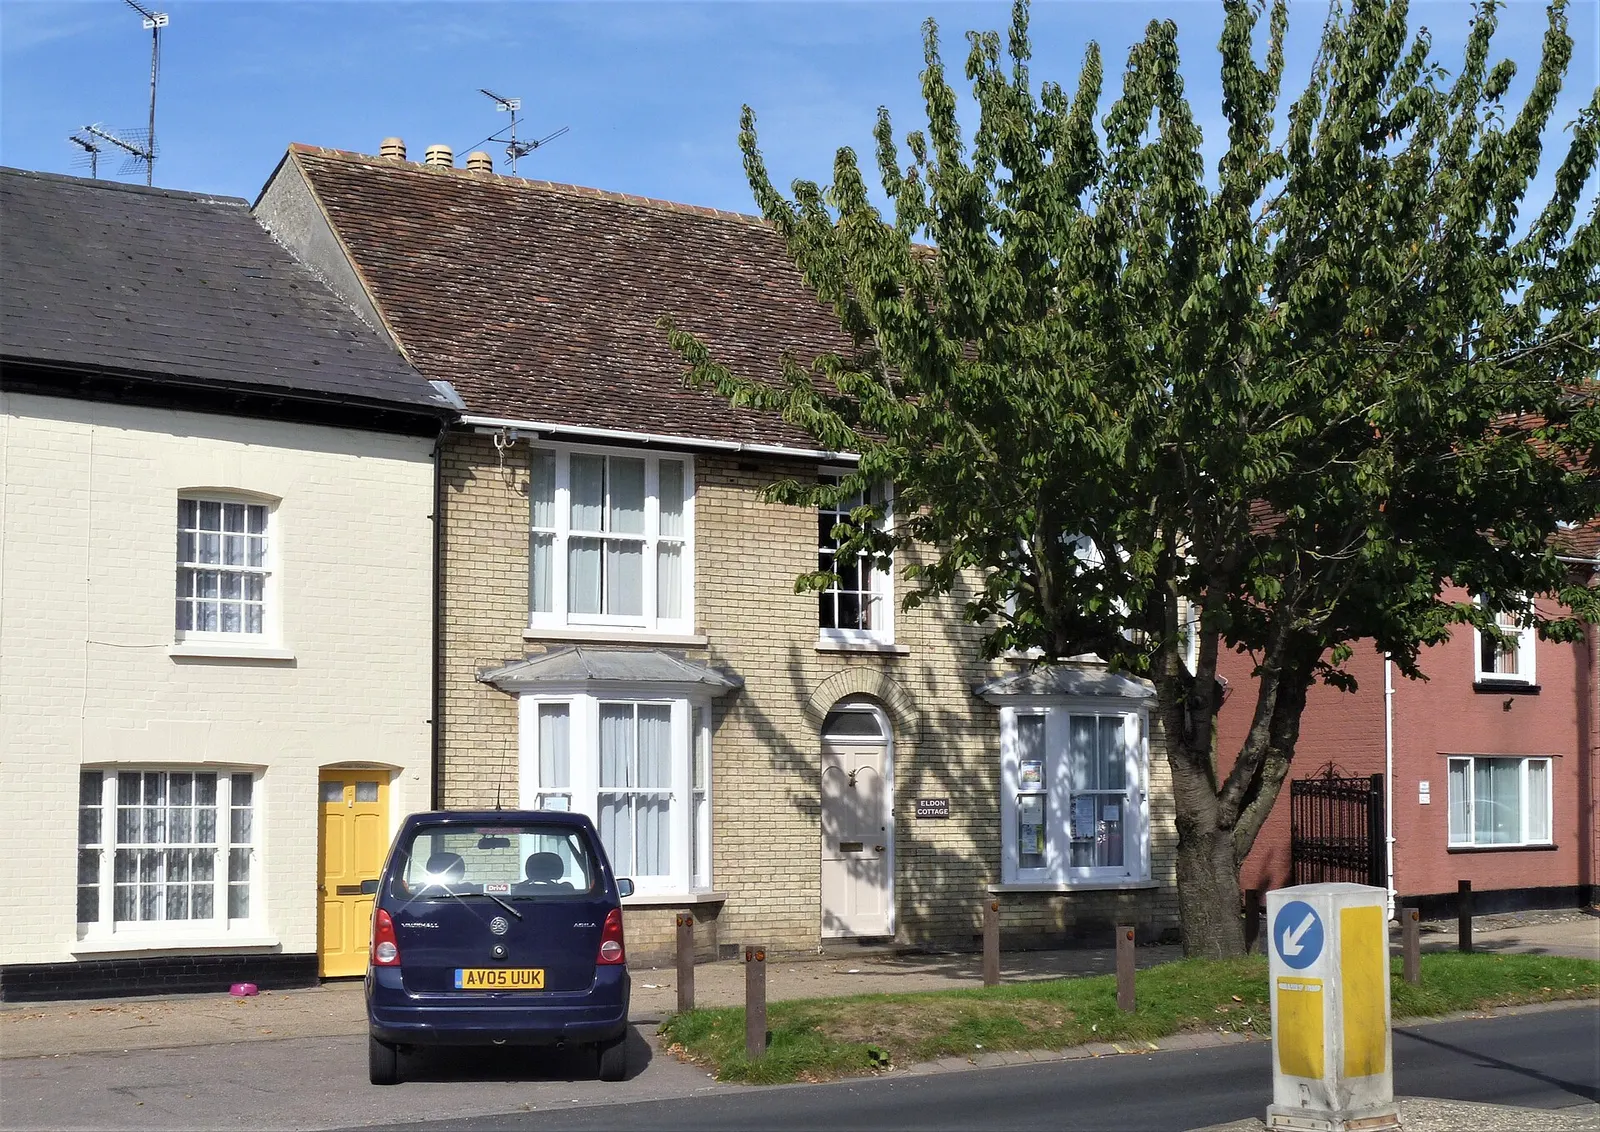
For anyone weighing up a move to Castle Point, the latest figures show a falling local average — and one below the Essex average. The average home price in Castle Point was £357,241 in August 2026.
The fall was steeper than the 0.3% annual decline across Essex. These averages are a guide to the market, not a price tag for any particular home.
How do Castle Point house prices compare with Essex?
| Area | Average house price | Change on a year earlier |
|---|---|---|
| Castle Point | £357,241 | down 4% |
| Essex | £359,433 | down 0.3% |
Source: HM Land Registry’s UK House Price Index, August 2026. The Essex annual change is from HM Land Registry’s local authority figures for the same month.
Castle Point’s average was below Essex’s, while its annual fall was sharper. A local average can still hide wide differences between homes and neighbourhoods.
What did first-time buyers pay in Castle Point?
First-time buyers paid an average of £307,215. That gives buyers a separate benchmark from the overall Castle Point average, but it does not show the price of homes currently for sale or how much a lender may let you borrow.
How can I check a Castle Point home’s sale price?
Use the HM Land Registry house price search to look up prices paid for homes in a specific area. You can also search the HM Land Registry price paid data.
Before deciding whether a home fits your budget, compare recent sales of similar properties and check other factors that matter to you, such as schools, crime rates and planned building nearby.
About the figures
HM Land Registry publishes the UK House Price Index. These figures cover August 2026 and were published on 21 October 2026. The index is based on completed sales, so it does not show current asking prices; figures may also be revised in later releases.